


Live Energy Intelligence
Observed activity.
Reported data.
Internal context.
One answer.
SynMax Intelligence helps energy teams see what is happening before delayed reports catch up. We combine satellite-derived activity, normalized public data, infrastructure monitoring, production history, and agentic AI so your team can move from scattered evidence to better decisions.
What SynMax Energy Delivers
Trusted by leading energy market teams, banks, hedge funds, operators, and government agencies.

Daily satellite monitoring

AI-driven energy workflows

Internal document intelligence

Market-ready forecasts and alerts
The Problem

The energy industry depends on information that most teams cannot access fast enough.
Energy teams do not lack data. They suffer from delayed, disconnected data trapped in places no one can easily search. Public reports arrive weeks late.
Operational knowledge sits inside PDFs, spreadsheets, shared drives, and data lakes never built to answer urgent questions.
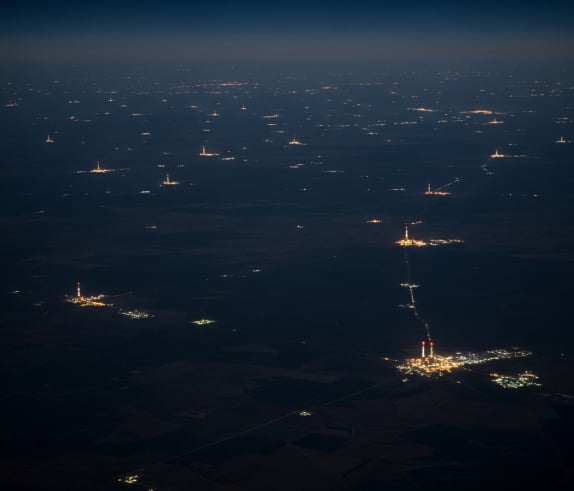
Meanwhile, rigs move. Frac crews arrive. Projects stall. Pipelines constrain growth. Competitors act.
By the time the full picture is clear, the decision window may already be gone.
The Solution
SynMax turns fragmented energy data into decision-ready intelligence.
We monitor real-world activity from space, normalize public and regulatory data, connect it to energy workflows, and let teams ask direct questions in plain language.
See the market from the ground up

Unlock your own operational knowledge

Move from signal to action
Our Solutions
BasinIQ
Oil & Gas
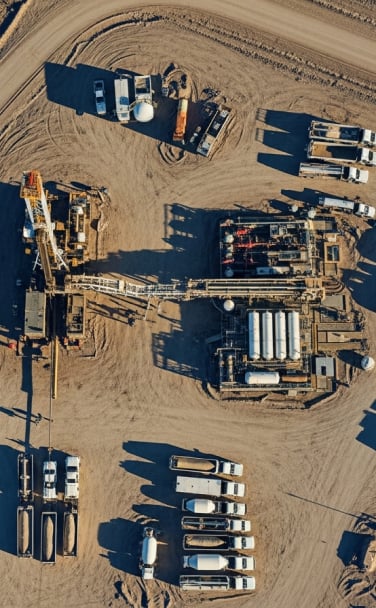
Track field activity, asset movement, and development risk.
Hyperion
Commodity Trading
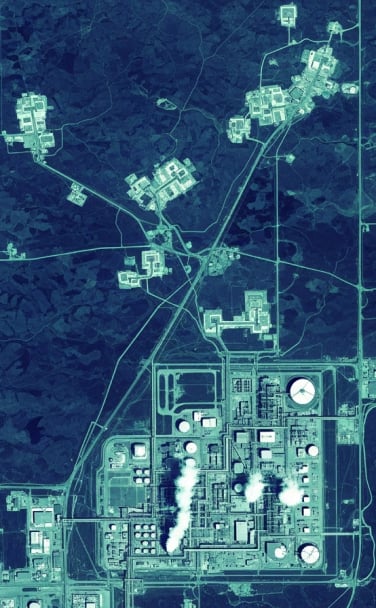
Trade on observed field activity, not stale reports or consensus assumptions.
Vulcan
Power & Data Centers
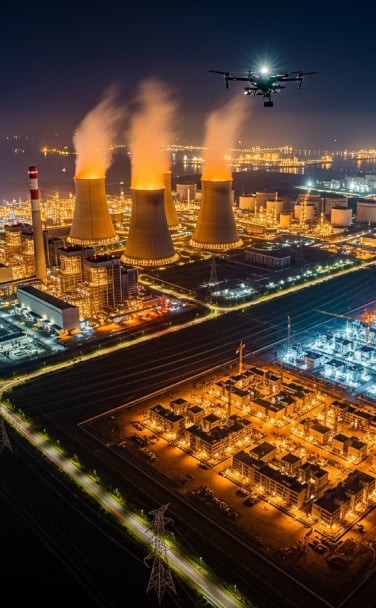
Track what is actually being built, delayed, damaged, or brought online.
What We Do
Intelligence into the market. Intelligence into your own data.
Most platforms focus on external market intelligence. SynMax does both.

Intelligence into the market

Intelligence into your own data
What changed in the field? What do our internal records say? What does that mean for the decision in front of us?
The Method
Observe. Connect. Act.
01 / OBSERVE
See the truth
Independent satellite, SAR, and sensor data captures real physical activity — wells, pipelines, plants — day and night.

02 / CONNECT
Unify your knowledge
Fuse outside observation with your own documents, reports, and data lakes into one queryable, domain-aware picture.

03 / ACT
Decide and execute
AI agents turn the picture into forecasts, alerts, and decision-ready outputs — before delayed data catches up.
Why SynMax
Built for energy teams that cannot wait for reported data.
SynMax Energy is not another dashboard of recycled public data. Our intelligence starts with independent observation — combining satellite-derived detection, AI, public and private datasets, and deep energy-market expertise to show what is really happening.

Observed, not just reported
Built for energy workflows

Designed to fit your stack

Built for decisions, not data storage
FAQ
Ask better questions. Get usable answers.
Which nearby pads show new construction activity this month?
BasinIQ tracks pad construction from daily satellite imagery, so new locations near your acreage show up as they break ground — weeks before they reach permit-derived datasets.
Where are frac crews active near our operated acreage?
Frac crew detections are mapped daily with 99% accuracy, so you can watch completion activity develop around your position instead of waiting on state filings.
Which competitor wells appear delayed versus public expectations?
Compare observed field activity against operator guidance and public schedules to spot wells with no crew on site, stalled pads, and slipping timelines.
Summarize recent completion reports for this asset.
Ask in plain language and BasinIQ parses your completion reports, drilling reports, and operational files into a sourced summary you can trace back to each document.
What do our internal files say about this well, operator, or acreage position?
BasinIQ searches your PDFs, spreadsheets, and data lakes alongside public records, returning answers with the underlying internal documents cited.
Where is production likely to shift before reported data confirms it?
Hyperion nowcasts production from satellite-observed rigs, frac crews, and TILs — running one to three months ahead of official EIA prints.
Which basins show changes in completion activity?
Daily basin-level monitoring separates rig and completion trends by gas versus oil, so momentum shifts surface while there is still edge in them.
Which TIL signals conflict with operator guidance?
Well-level turn-in-line monitoring at 98% accuracy flags starts that disagree with guidance — before the discrepancy reaches public data.
How should today’s field activity change our supply forecast?
Ask Hyperion’s agents directly: they tie observed activity to historical production and pipeline flows, and pull live Bloomberg prices next to the physical evidence.
Which proposed power plants have actually broken ground?
Vulcan verifies construction with weekly satellite and drone imagery, turning developer claims into physical evidence you can check.
Which projects appear stalled or delayed?
Construction monitoring catches sites with no visible progress, so capacity models rest on what is being built rather than what was announced.
What changed at this facility after the weather event?
Thermal and optical imagery confirm outages and damage independently — no waiting on operator disclosure.
Which data center or power projects should be included in our capacity model?
Track buildout across power infrastructure, LNG facilities, and data centers with ground-truth status per site, ready to feed your model.
Resources
-
How Many Wells Could This Acreage Support?
Generate potential well layouts, test development assumptions, and estimate acreage value before committing to a full…
-
Know What You Are Buying Before You Bid
BasinIQ for Oil & Gas M&A Every acquisition starts with imperfect information. The buyer receives a…
-
Make Reservoir Simulation a Living Workflow
Use BasinIQ to prepare model inputs, identify meaningful changes, and support more frequent simulation updates. A reservoir model may take months to build. The…
Get Started
Your next energy decision should not depend on stale data.
SynMax Energy helps your team see activity earlier, unlock internal knowledge, and act before delayed data slows the decision down.