


Capability
Both sides
of the equation.
US natural gas, balanced every day.
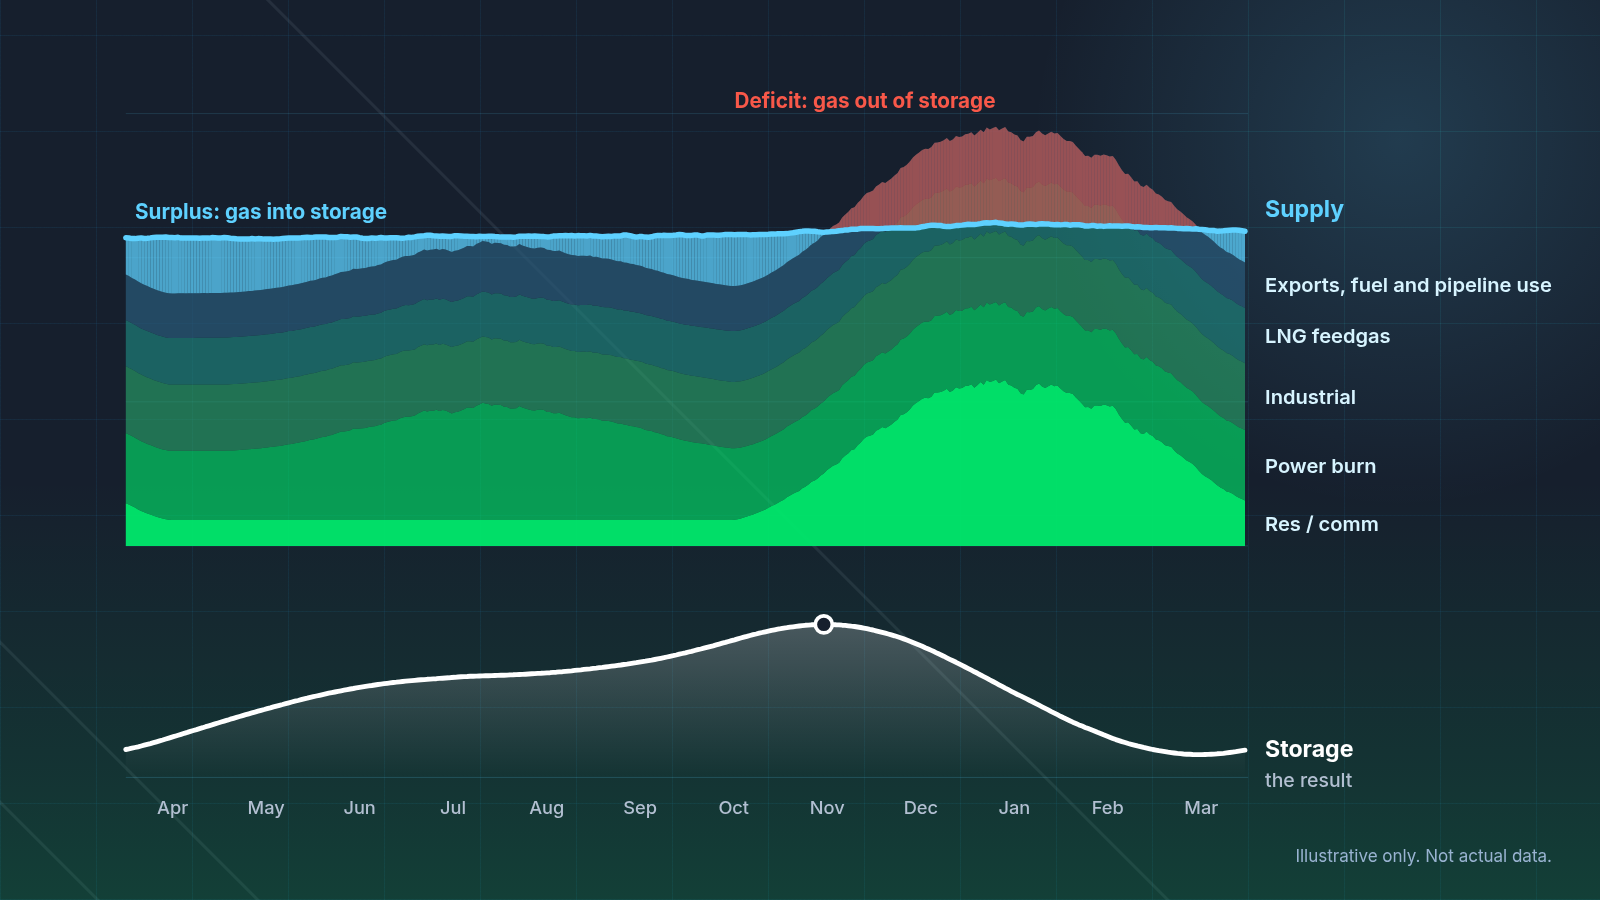
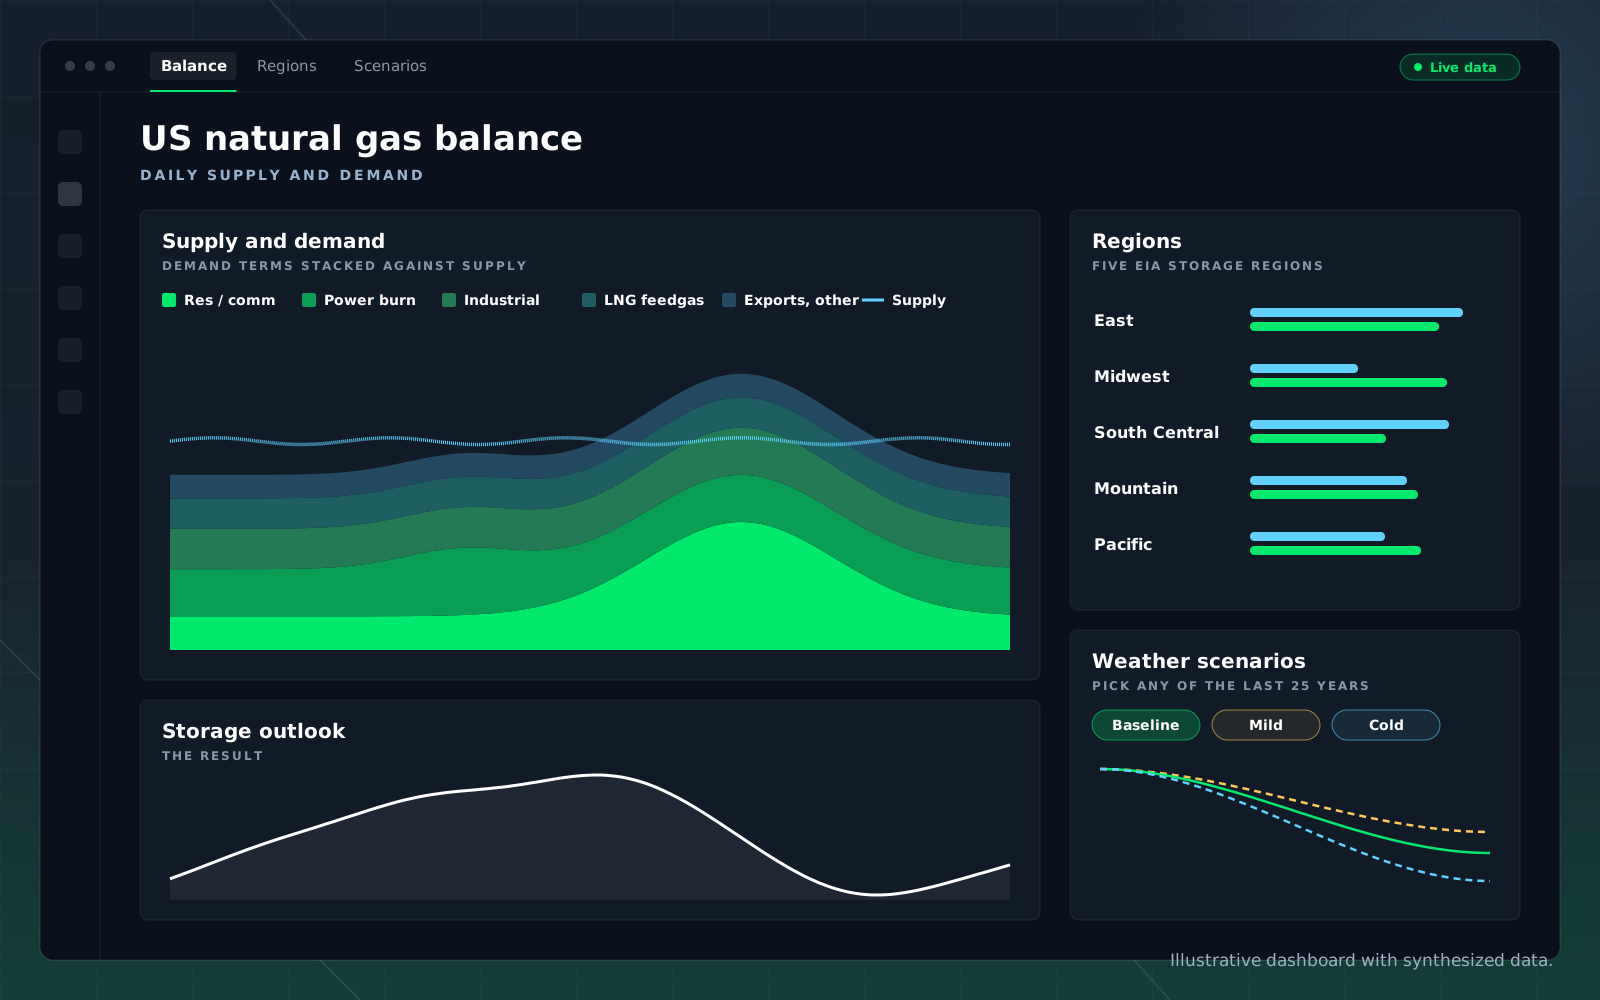
Hyperion balances US natural gas supply against every demand term every day and shows where storage is heading, with daily history back to January 2024 and daily forecasts two years forward.
What Is In the Balance
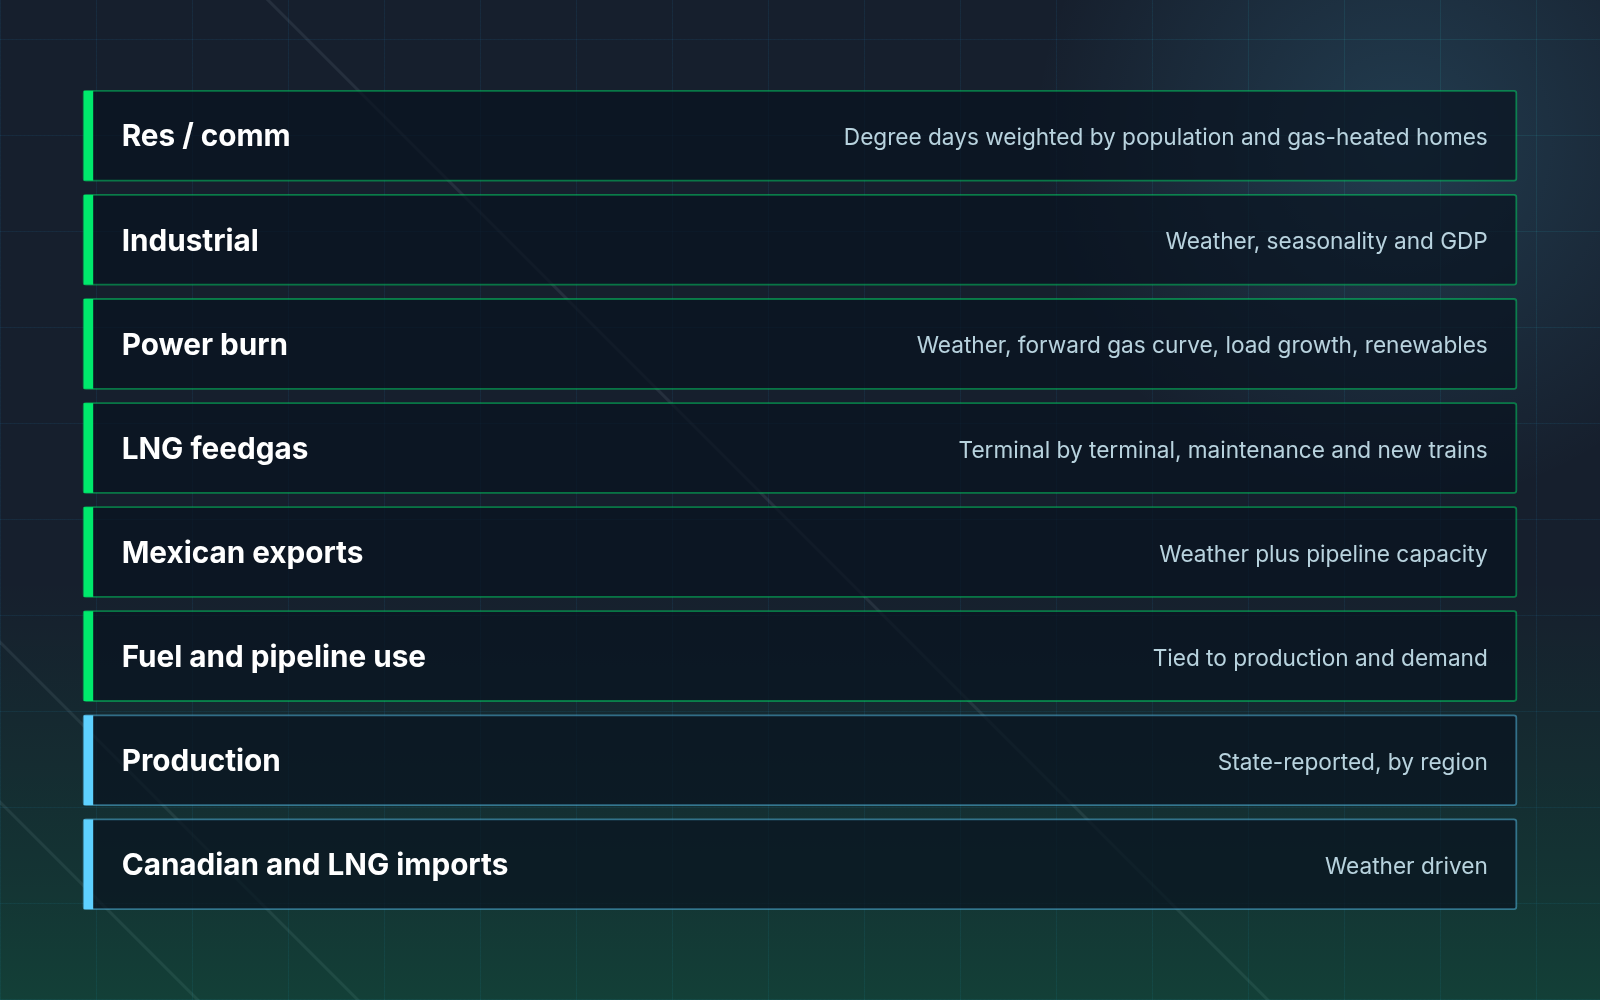
Every term, modeled on its own drivers.
A storage outlook is only as reliable as the terms that feed it. Each part of US supply and demand is modeled separately, on what actually moves it, then balanced against the others. A balancing factor reconciles state-reported production with reported storage, so the balance ties out week to week.
Method
A baseline that keeps the peaks.
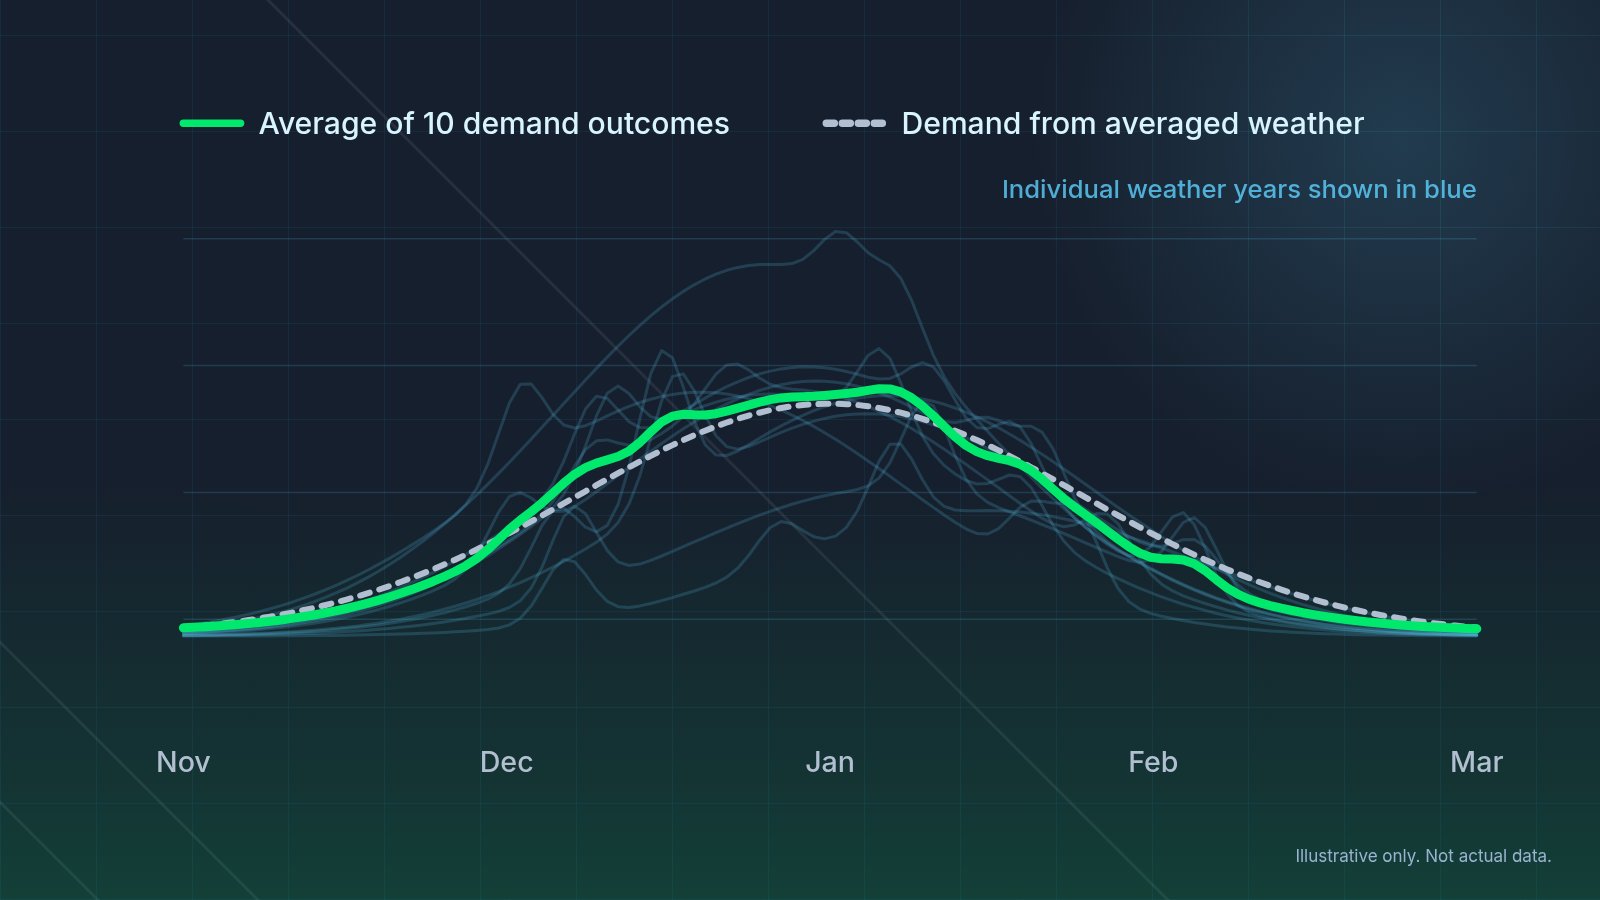
Most baselines average ten years of weather, then run one forecast. Hyperion runs each of the last ten weather years through its demand models and averages the ten demand outcomes.
Demand responds to cold unevenly, so the order matters. Averaging demand keeps winter and summer peaks in the baseline instead of smoothing them away. The storage baseline is built the same way.
Scenarios
Test any winter.
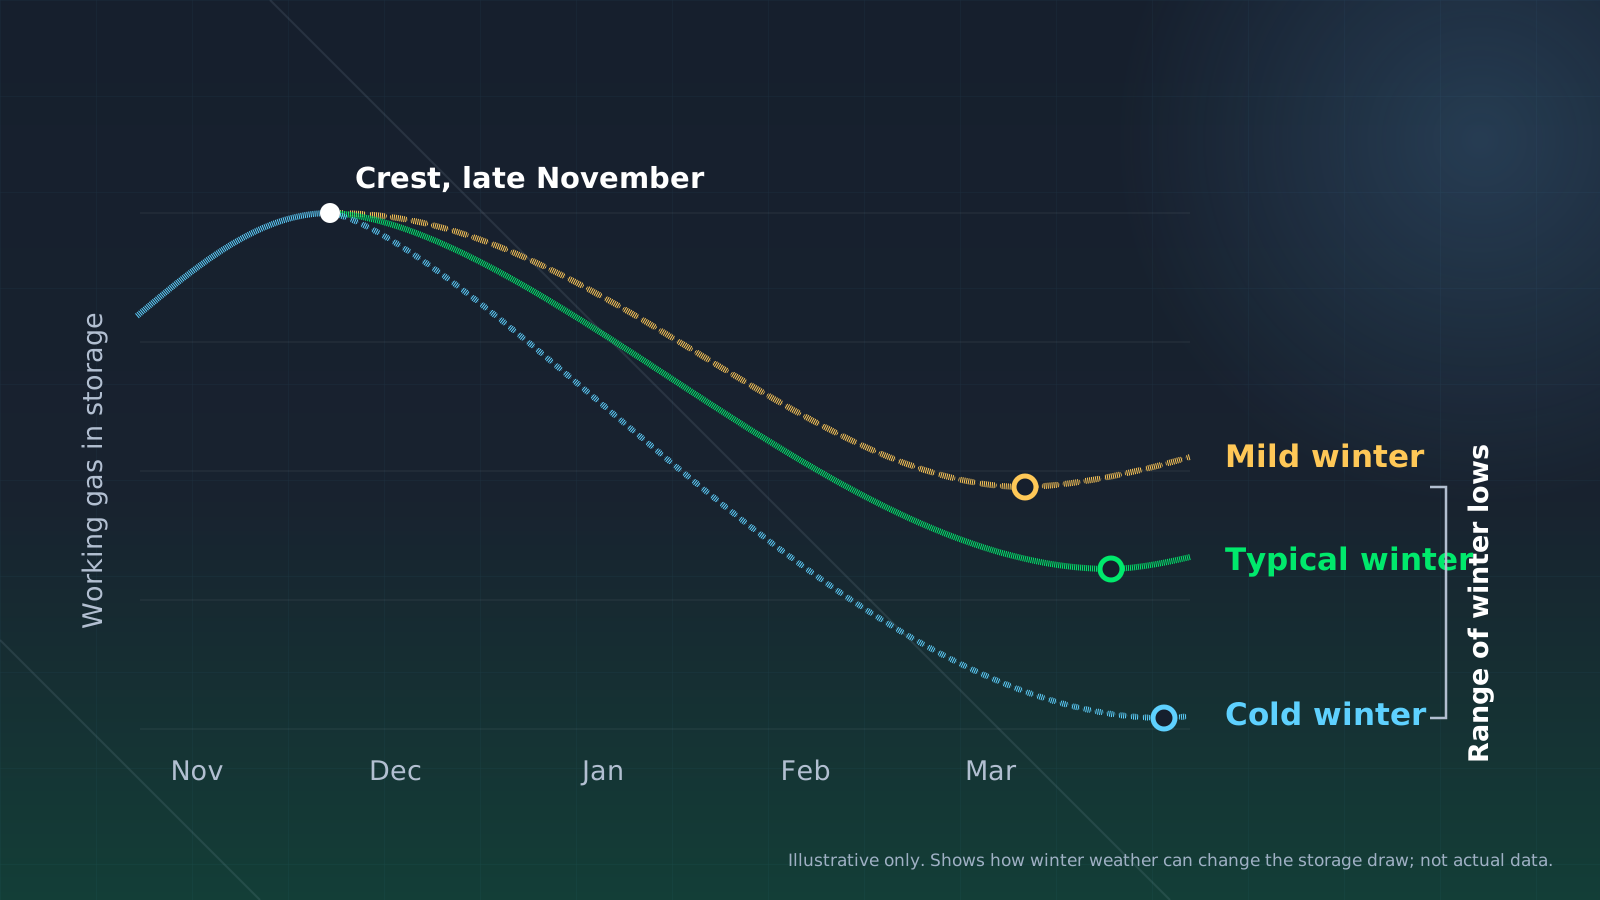
Choose the baseline or any of the last 25 weather years. Every weather-driven term responds, from residential demand to LNG feedgas to imports and exports, and storage follows.
Put a mild winter next to a polar-vortex winter and see how far apart the end-of-season lows land.
Regional Detail
Regional where it counts.
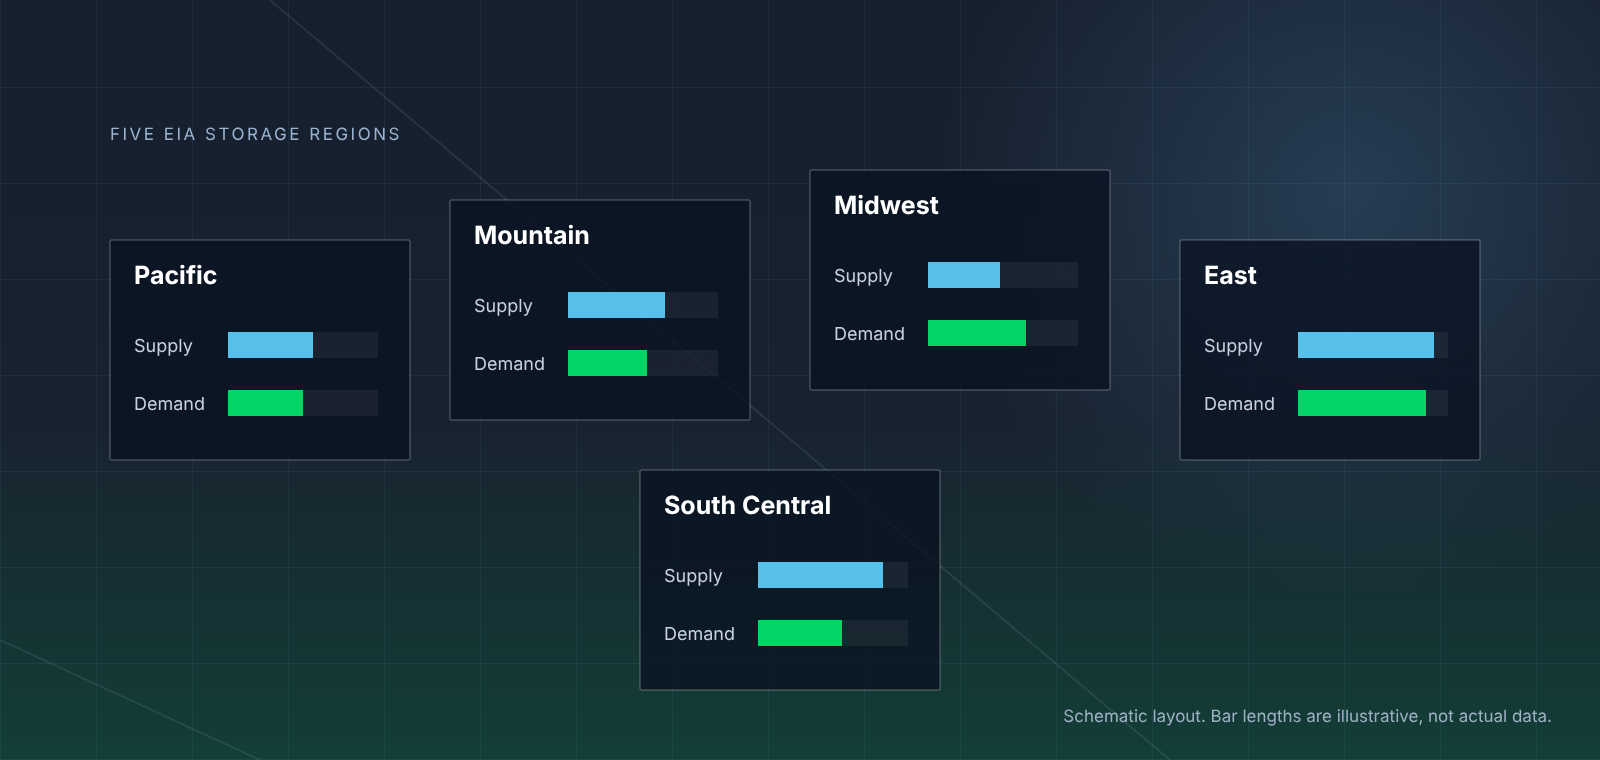
A national number hides where the tightness is. Production and every demand term break out across the five EIA storage regions: East, Midwest, South Central, Mountain and Pacific.
Two Terms Up Close
Where the balance moves fastest.

LNG feedgas, terminal by terminal

Power burn that follows price
In the Platform
The balance, on one screen.
Supply against every demand term, the storage outlook, the five regions and your weather scenarios in one view.
Who Uses It
One balance, three decisions.
The same balance answers different questions depending on the desk asking.

Gas traders
Utilities and power desks
LNG and midstream
Access
However your desk works.

Quick View

Dashboards

API

Data tables
FAQ
Questions buyers ask.
How often does the balance update?
Daily, with intraday refreshes.
How far back and how far forward does it go?
Daily history starts in January 2024. Daily forecasts run two years forward.
Why average demand outcomes instead of averaging weather?
Demand does not rise in a straight line with cold. Averaging ten years of weather first produces a mild, smooth year that never happened, and the demand peaks disappear with it. Running each weather year through the demand models and then averaging the results keeps those peaks in the baseline.
Which weather years can I test?
The baseline or any of the last 25 weather years. Every weather-driven term responds, and storage follows.
How does the balance tie to reported storage?
A balancing factor reconciles state-reported production with reported storage, so the balance ties out week to week.
Is the balance regional?
Yes. Production and every demand term break out across the five EIA storage regions: East, Midwest, South Central, Mountain and Pacific.
How do I access it?
Through Quick View in the Hyperion application, ready-made dashboards built on Atlas, the API, or data tables for your own models.
Get Started
See where storage lands.
Walk through the balance, the weather scenarios and the dashboards with our natural gas analysts.