

Capability
Inventory you can see,
not inventory you await.
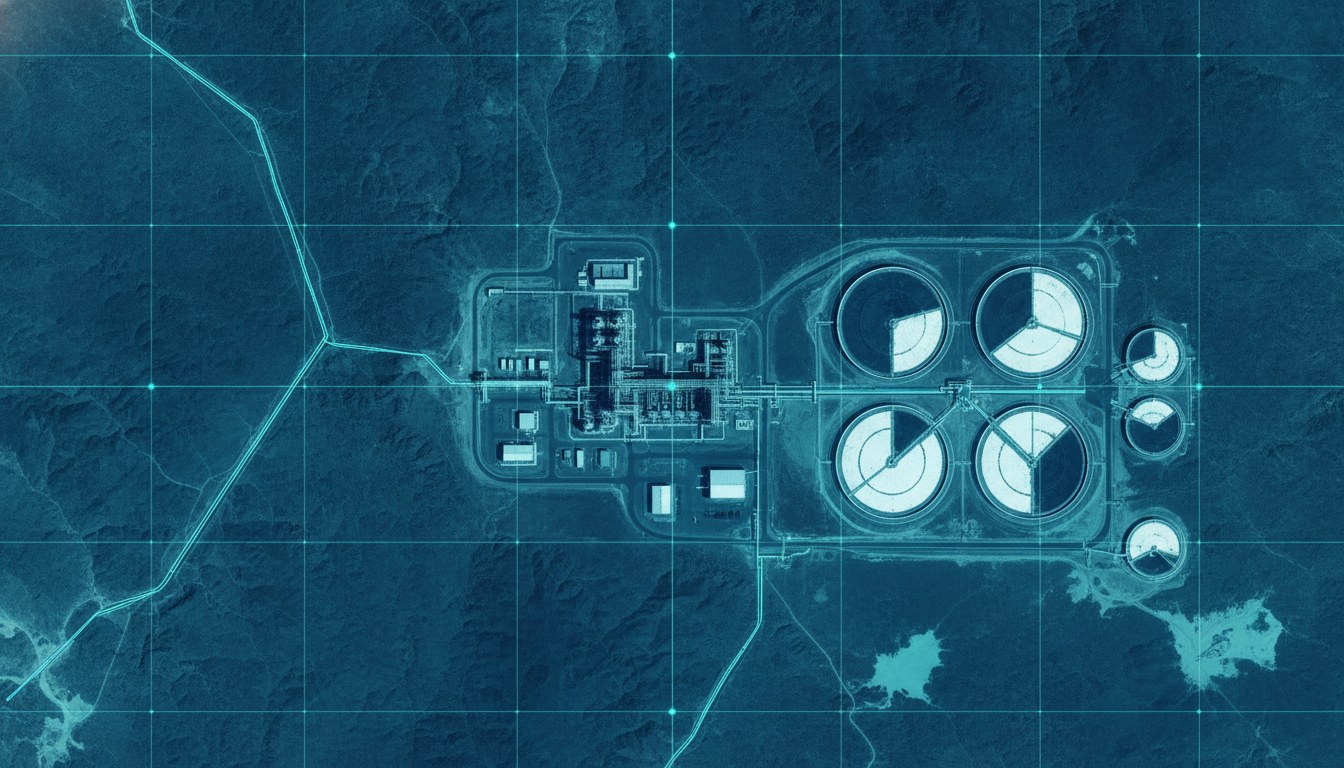
Every tank, every facility, one number.
SynMax builds inventory facility by facility at storage hubs and terminals, on your schedule rather than the release calendar, so you hold a defensible view of the number before it is published.
The Problem
Everyone gets the inventory number at the same moment.
Weekly and monthly inventory releases are the most crowded trade in the market. The edge is not in reading the number faster; it is in having a defensible view before the number exists.

Every tank, accounted for

Terminals show throughput

Ahead of the calendar

Site by site
Site by Site
Take the regional number apart.
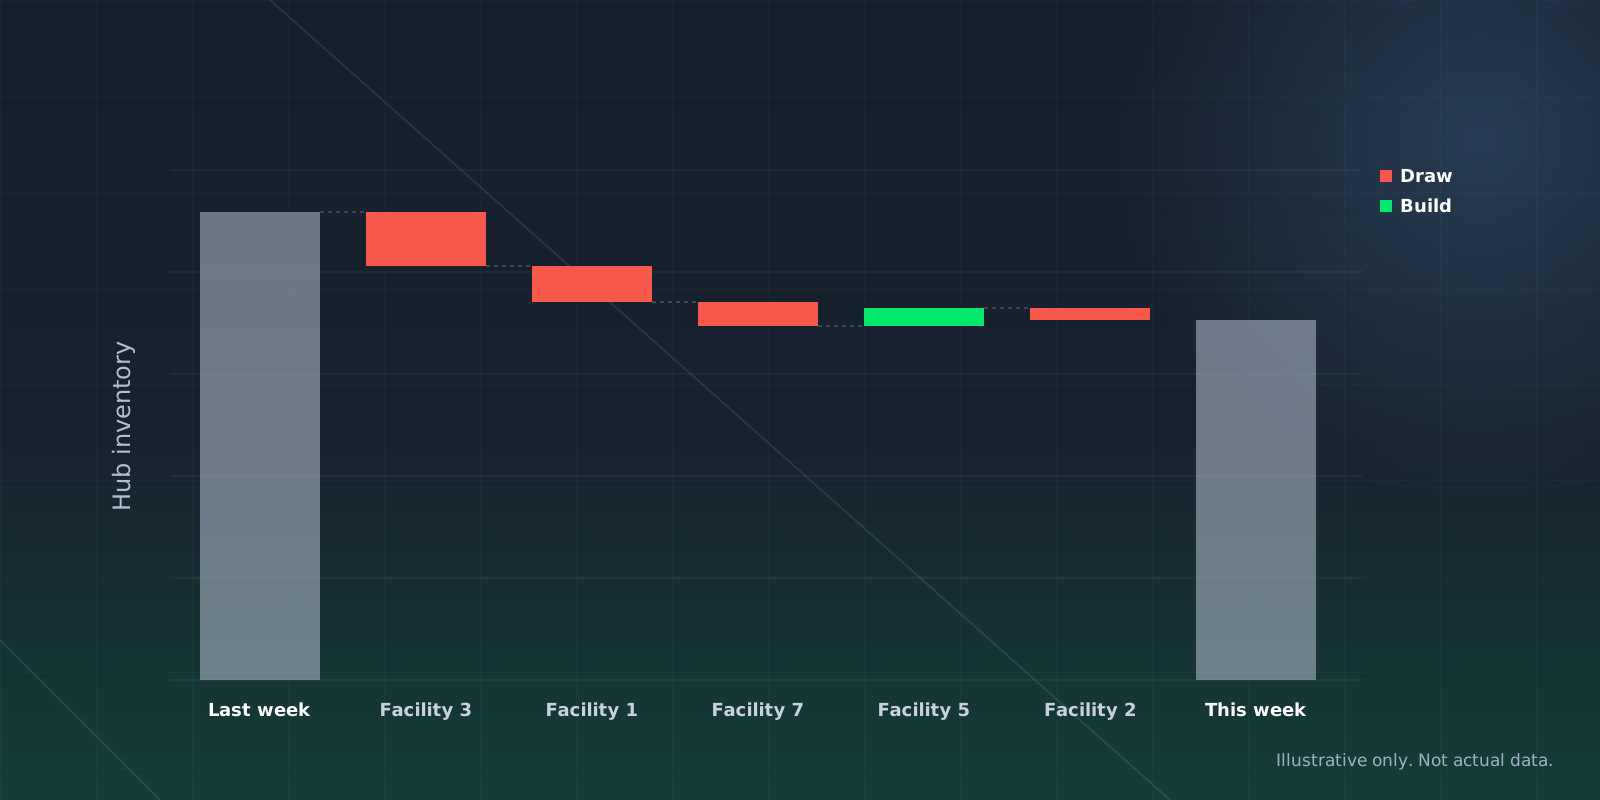
A published inventory figure is a single number. When it moves, it does not say why.
Because inventory is built up from individual facilities, a draw or a build breaks down into the sites that drove it. That turns a surprise in the release into a question you can already answer.
How It Works
Tank, terminal, trend.

01 / MEASURE
Know every tank
Levels for individual tanks at each facility, so a hub is never a black box.
02 / WATCH
Track the terminal
Berth activity, vessel calls and ground movement show throughput that tank levels alone would miss.

03 / TREND
Build the series
Site-level readings aggregate into regional inventory series with history, so a move reads against its own baseline.
Across the Region
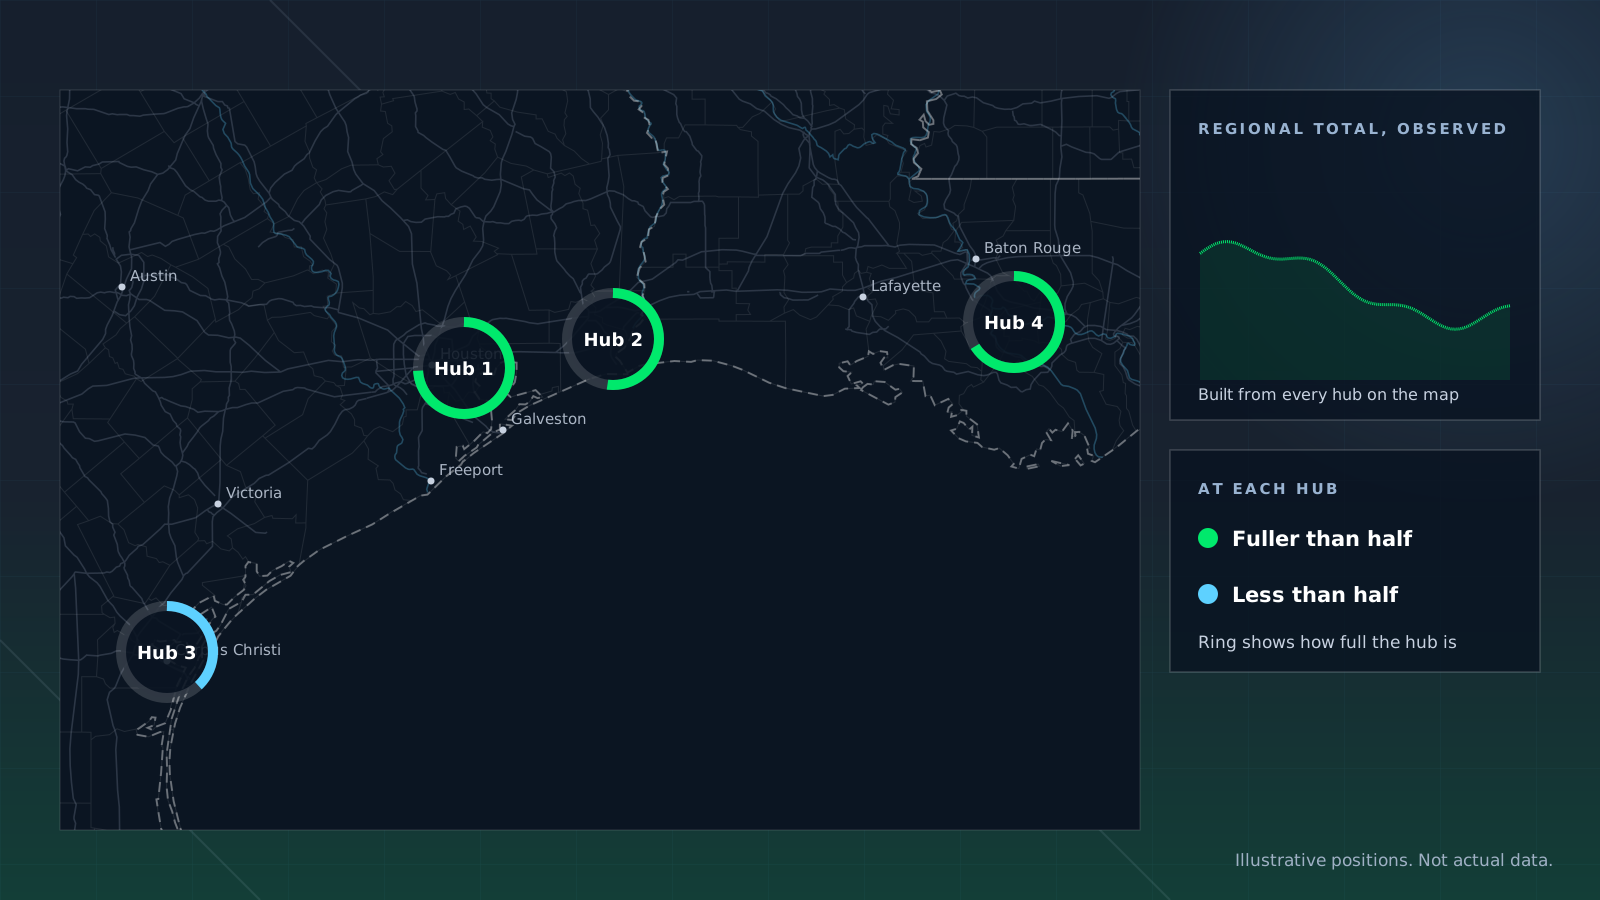
Every hub on one map.
Hubs and terminals across a region are covered on the same basis, with vessel calls and ground activity alongside inventory, so throughput that no release breaks out is part of the picture.
Facilities roll up into hubs and hubs into regional series with history, so each move reads against its own baseline.
Coverage
What is in the record.
Inventory built up from individual tanks and terminals, so a regional number can be taken apart.
In the Platform
Inventory, site by site.
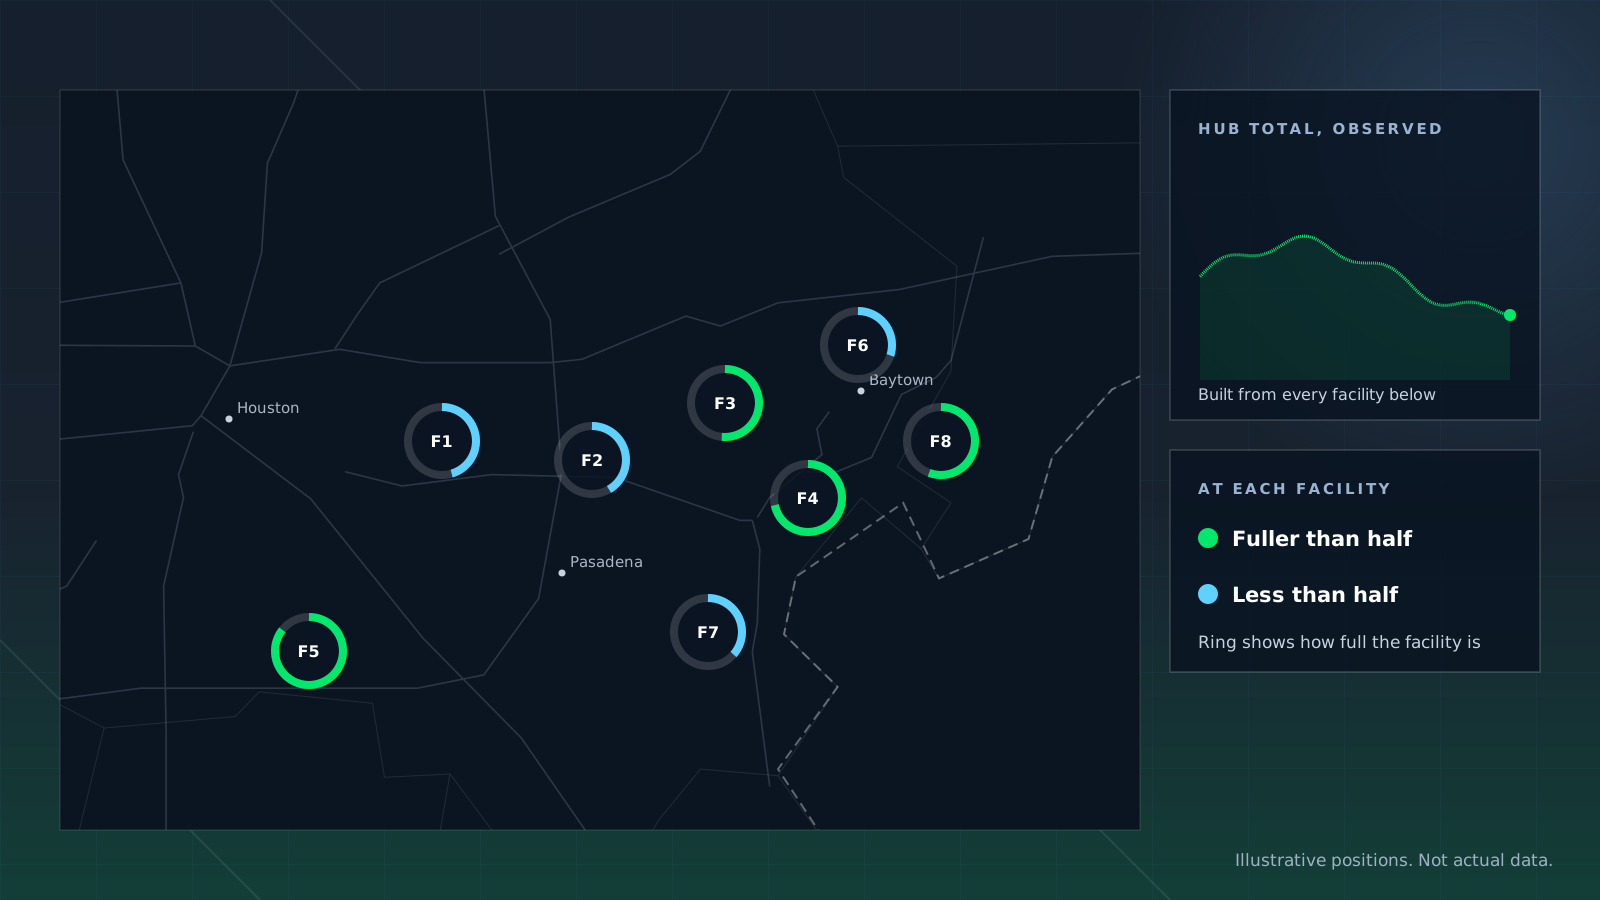
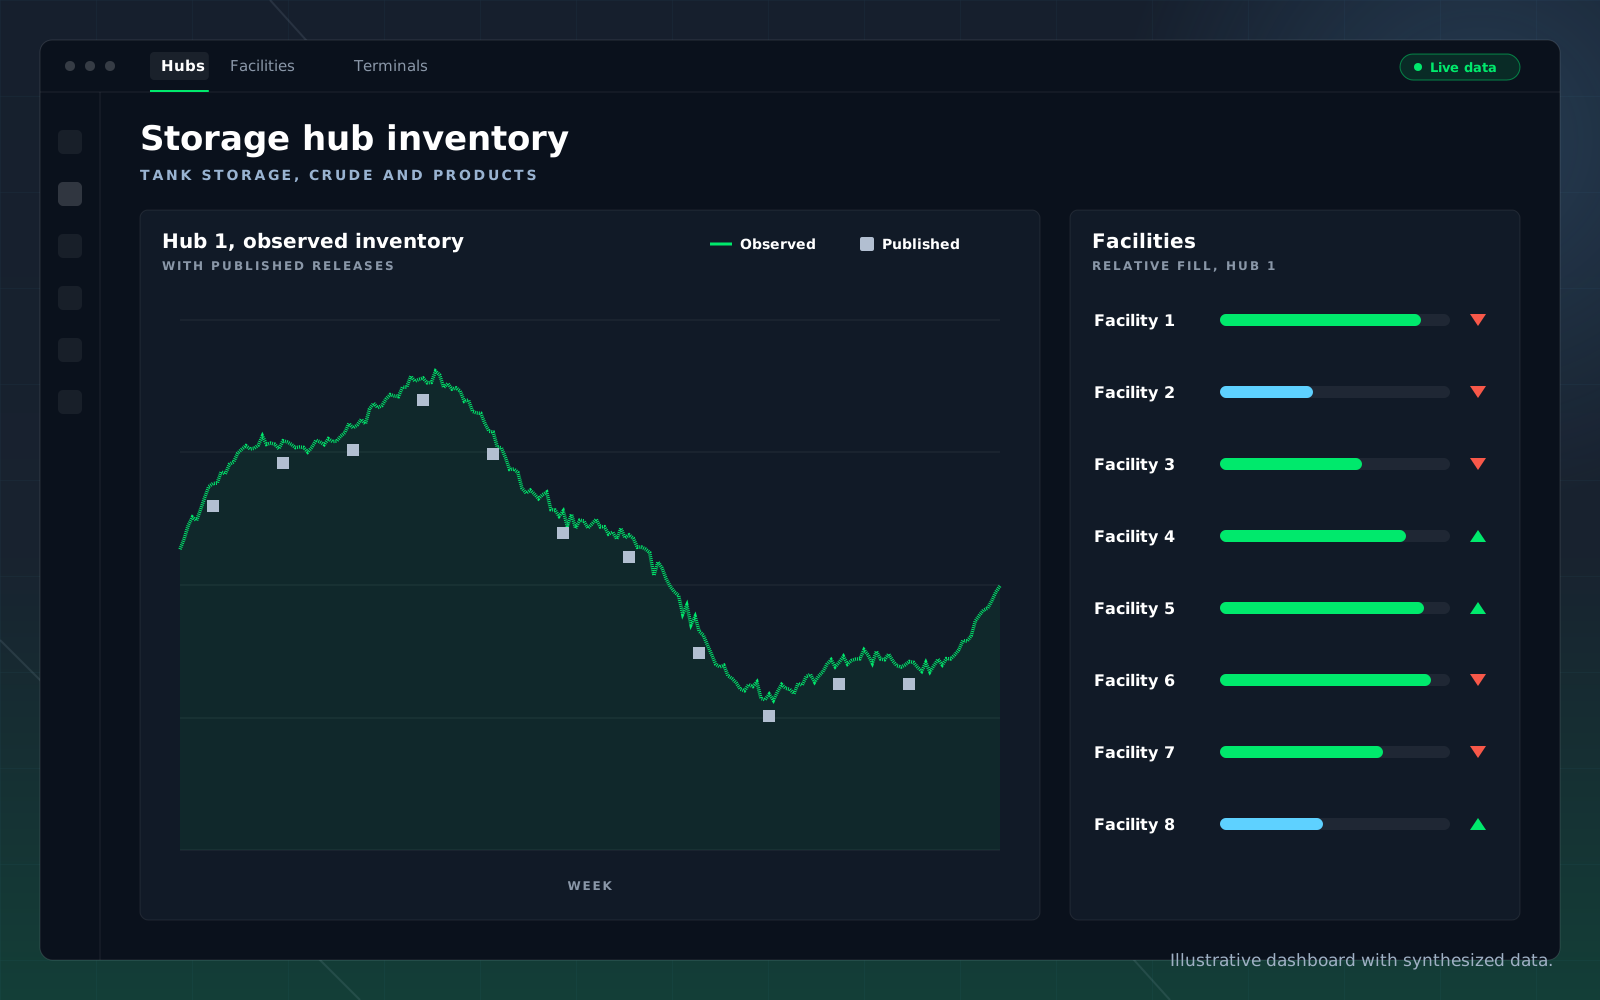
The observed inventory series for a hub, with each facility’s fill level beside it.
When the hub moves, the facility list shows which sites moved it, so the reason behind a draw or a build is on the same screen as the number.
Who Uses It
One record, three decisions.
The same inventory record answers different questions depending on the desk asking.
Oil and products traders
Terminal operators

Analysts
Use Cases
What you can ask it.
What are tank levels at this storage hub?
How has inventory here moved over the last month?
How much throughput is this terminal handling?

Which facilities are drawing down fastest?
How does observed inventory compare with the reported number?

What is building in regional storage before the release?
FAQ
Questions buyers ask.
What does it cover?
Above-ground tank storage at hubs and terminals, read tank by tank and rolled up into regional inventory series with history.
Is this natural gas storage?
No. This covers above-ground tank storage of liquids such as crude and refined products. US natural gas storage is underground and is covered by the Hyperion supply and demand balance.
How does it compare with reported inventory?
The observed series can be set next to the published one, so you see where they agree and where the observed number moved first.
Can I see terminal throughput?
Yes. Berth activity, vessel calls and ground movement show what is moving through a terminal.
How do I get the data?
In the platform, through agents, by API, in Snowflake or in Excel, so the answer arrives in the system your team already uses.
Get Started
See inventory before the release.
Name a hub or a terminal you trade around and we will show you the observed inventory series next to the published one.