

Hyperion · Commodity Trading
Trade on what is happening now, not what gets reported later.
Hyperion tracks rigs, frac crews, turn-in-lines, pipeline flows, and production shifts across North America with daily satellite imaging, so you see market-moving activity weeks before it reaches EIA reports or state filings.
Trusted by Energy Market Teams Who Need a Timing Edge
Daily
Satellite monitoring across North America
Lower 48
Every interstate pipeline scraped
99%
Frac crew activity accuracy
98%
TIL monitoring accuracy
1–3 months
Ahead of official EIA production data
API
Your stack: API, Snowflake, Excel, plus agentic integration with Bloomberg Terminals
The Problem

The data most traders rely on is already late.
Filings, surveys, and reported figures land after the market has already moved on them. By the time production shows up in an EIA report, the trade is crowded. Hyperion gives you a direct view of physical activity in the field, so you can update forecasts and build conviction before consensus catches up.
The Solution
Hyperion shows the ground truth of activity.
Hyperion watches oil and gas activity directly from space, then ties it to historical production, pipeline flows, and your trading workflow. No surveys. No stale filings.

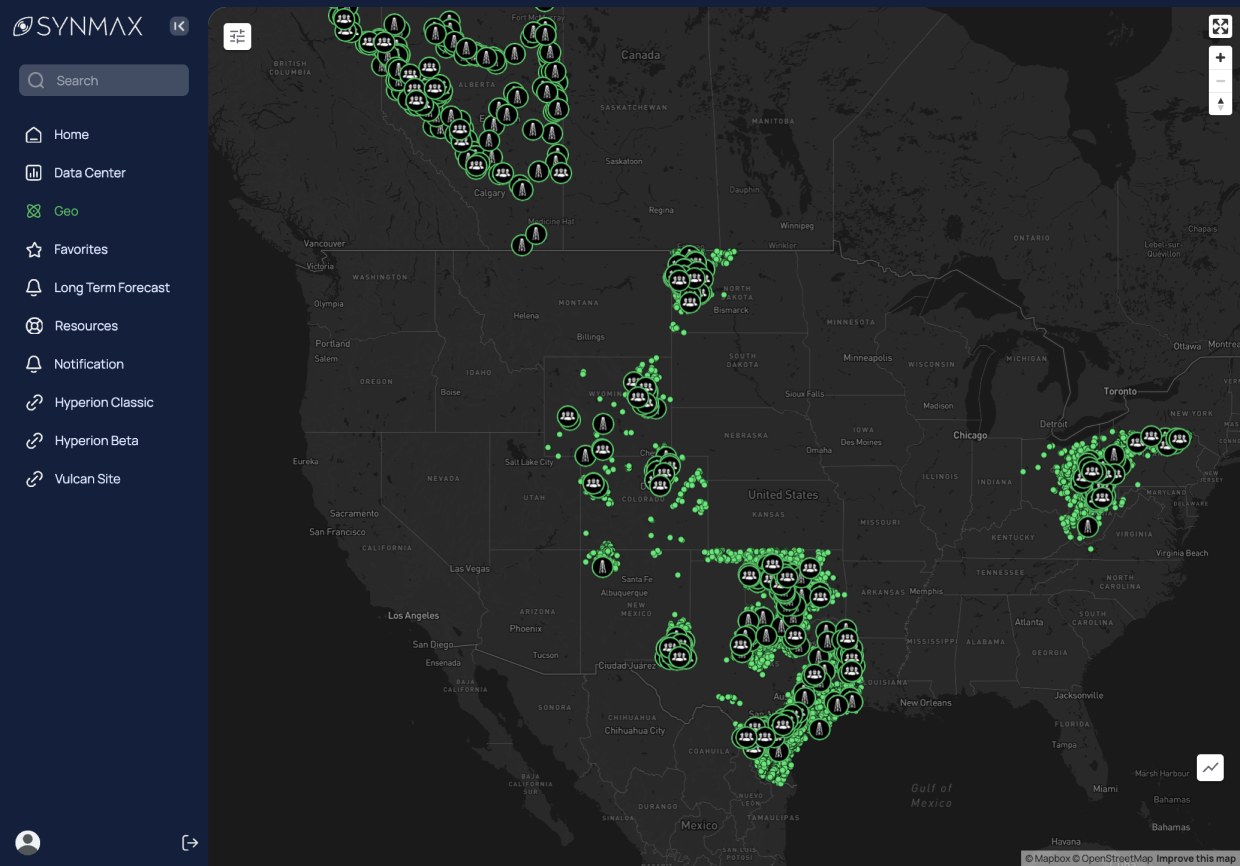
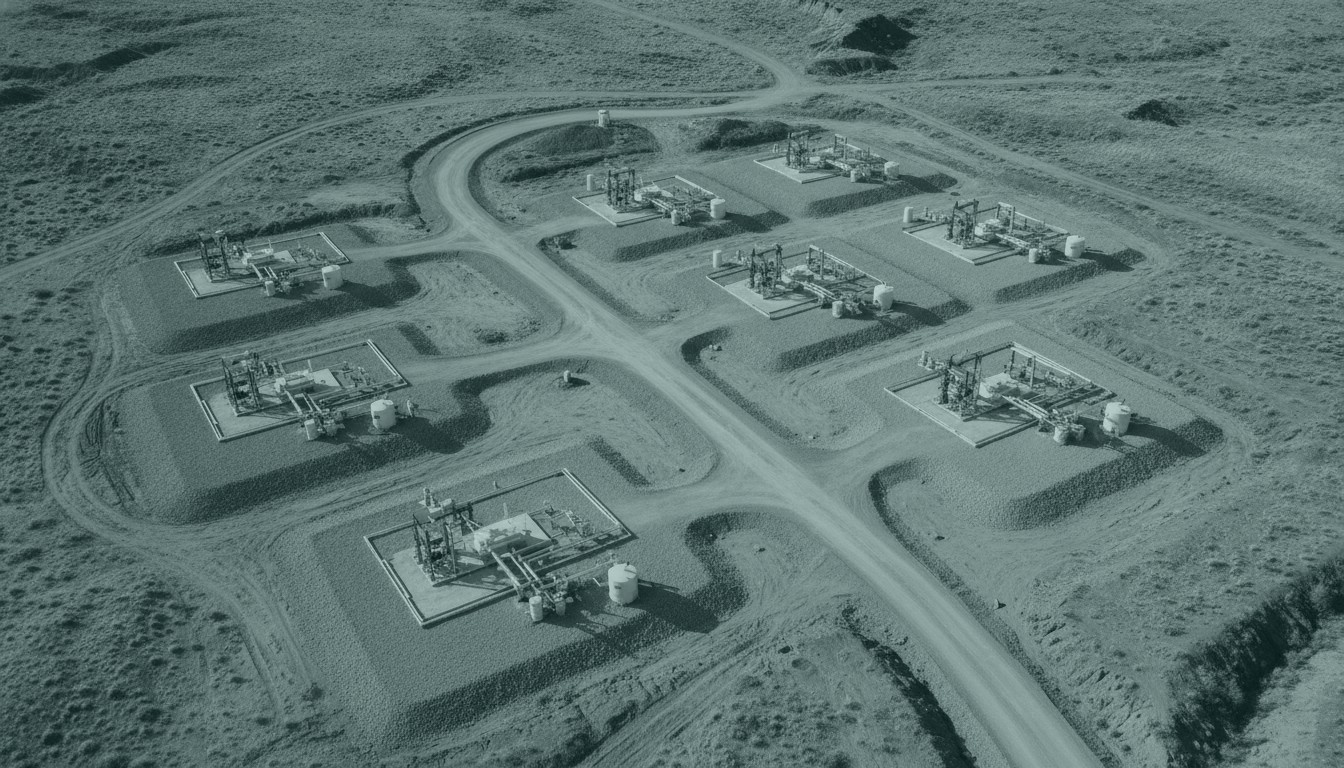
Daily satellite imaging of North American wellpads
Monitoring for rigs, frac crews, DUCs, TILs, and production signals

Machine learning models built on observed field activity

Forecasts anchored in reality, not proxies
The Problem
Built for desks that can’t wait on the reporting cycle.
You shouldn’t have to size a position on a production number that’s already two months old. Hyperion was built to close that gap.

1–3 months ahead of EIA
Strongest live price tracker

A rig count observed, not surveyed
How It Works
Observe → Validate → Forecast

01 / Observe
Observe activity from space
Hyperion detects physical activity from space, including rigs, frac crews, pad activity, and infrastructure changes.
02 / Validate
Validate against the record
Those observations are cross-checked against historical production, pipeline data, operator behavior, and market datasets.
03 / Act
Act through natural-language workflows
Ask questions, generate summaries, build maps, and structure reports, integrate your Bloomberg Terminal for live pricing, and act quickly before the market moves.
From Observation to Position
The only energy dataset that reaches into your trading stack.
Most energy data providers hand you a feed and leave the rest to you — you read their numbers, then switch to your terminal to act. Hyperion works in one motion. Ask a question in plain language, and its agents pull satellite-observed field activity, tie it to production and pipeline flows, and reach live into Bloomberg and Interactive Brokers to put current prices, curves, and positions next to the physical evidence.
See the activity

Pull the market

Act on it
One place to go from what’s happening in the field to what it means for your book.
Example
See the delay before the market does.
A well looks on schedule in public data — but Hyperion sees no frac crew, no TIL signal, and delayed field movement. Your model updates before the lagging report does: the difference between reacting to reported data and trading on observed activity.
Core Value
In trading, the second best data source is worth nothing.
Drilling

Rigs + frac crews
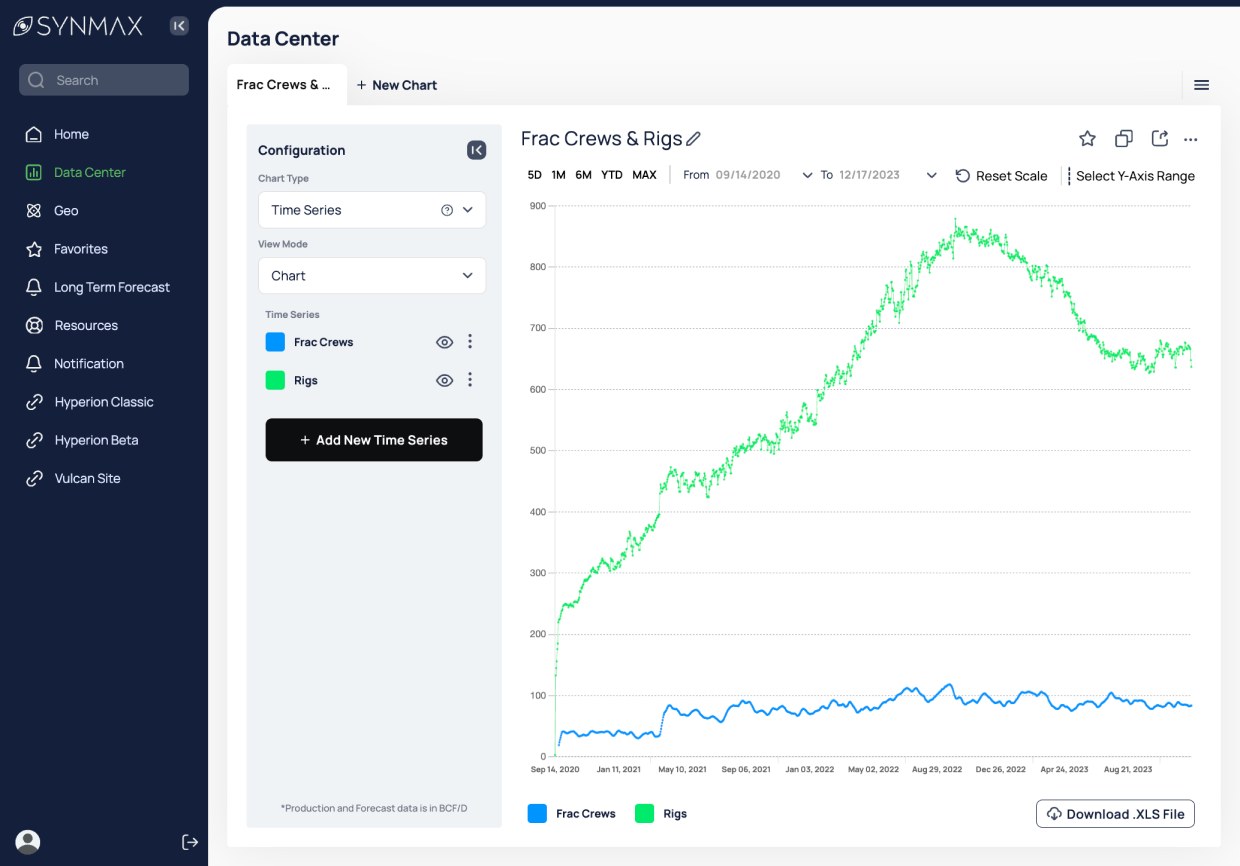
Track drilling and completion activity daily across the U.S. and Canada, with 99% accuracy on frac crew activity.
Production
Production forecasts
Forecast short-term oil and gas production using satellite observations, historical state-reported data, and machine learning.
Completions
Turn-in-line monitoring
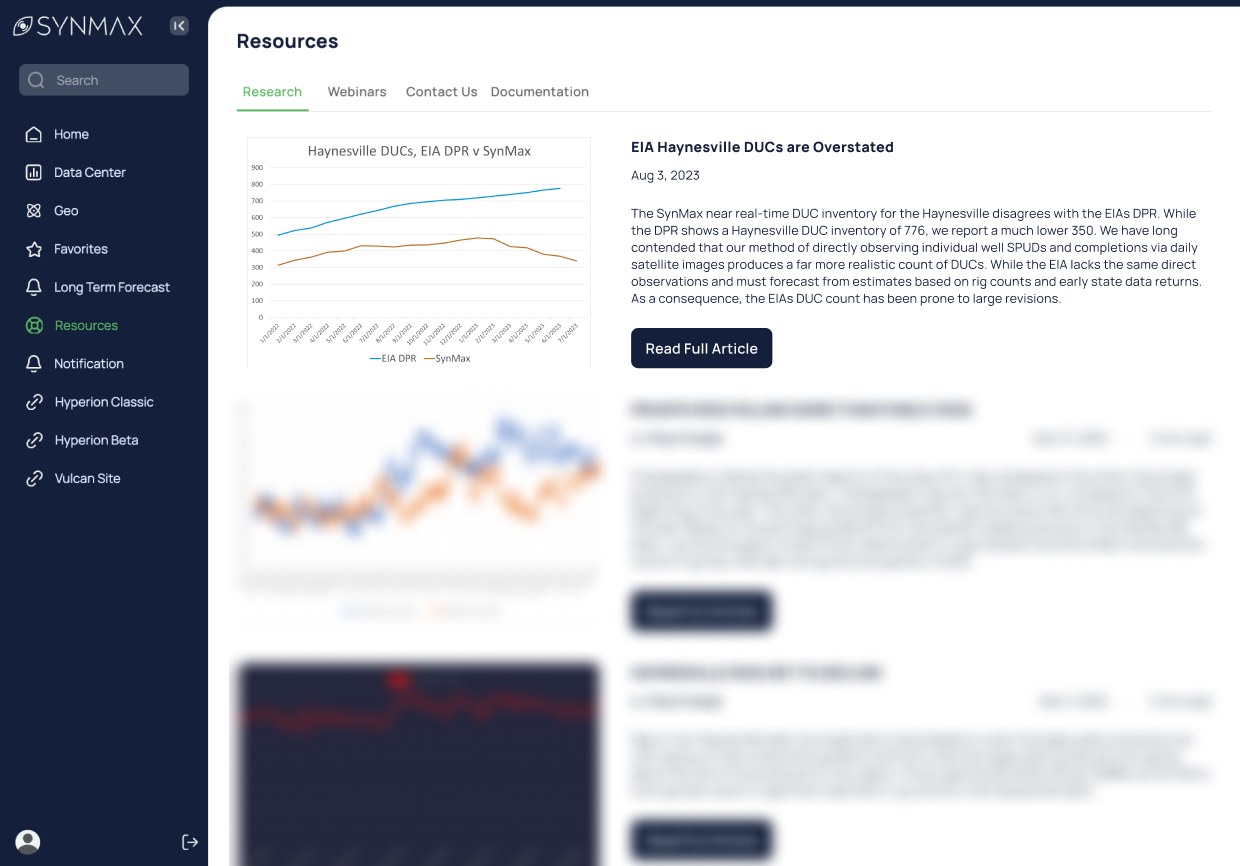
Track delayed well start dates directly at scale. Hyperion monitors well-level TIL events with 98% accuracy versus state data and operator guidance.
Midstream

Pipeline intelligence
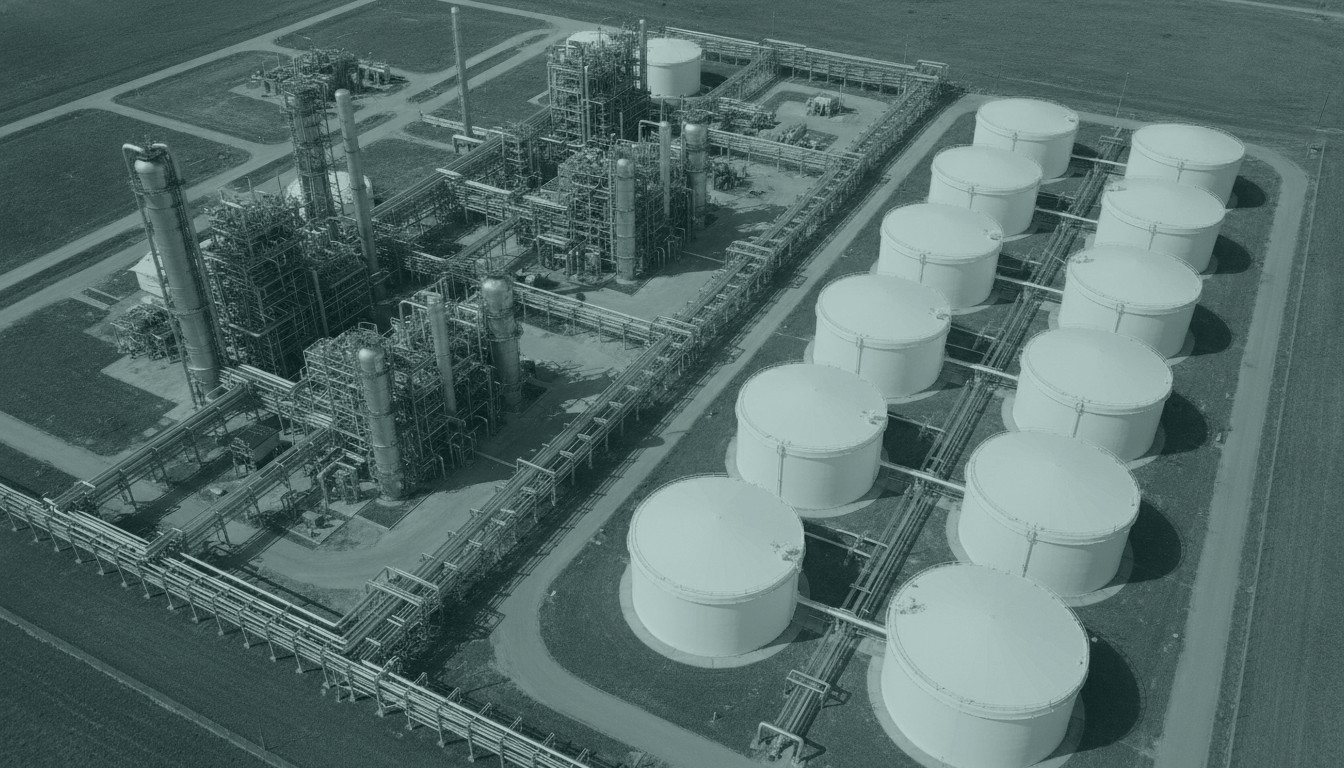
Use scrapes from every interstate pipeline in the lower 48 to connect field activity with market-moving infrastructure signals.
Differentiation
Built on observation, not reporting.
Every conventional energy dataset — EIA reports, state filings, operator guidance, survey-based feeds — is a record of what was reported. Hyperion is a record of what’s happening. Satellite imagery, machine learning, historical production, and pipeline flows combine into a view of supply that reporting-based providers structurally can’t match, because they’re waiting on the same filings you are.
Conventional rig counts are assembled from weekly operator and contractor surveys. A report of what was said, gathered on a lag. Hyperion counts rigs by observing the pads directly, every day, and separates them by basin and by gas or oil. Instead of the same number, faster, it’s a more direct way of measuring what’s actually turning.
Hyperion Agents
Ask questions. Get answers instantly.
It’s like having a dedicated energy analyst running in the background. One that never sleeps and never loses the thread. Ask a question in plain language and get answers you can trace back to the underlying Hyperion data. And unlike a data feed, the agents reach into the tools you trade with, pulling live Bloomberg prices and connecting to your execution systems, with answers you can trace back to the underlying Hyperion data.
Generate charts, tables, and models instantly
Run scenario analysis without coding
Automate monitoring and recurring workflows

Produce explainable outputs grounded in Hyperion data
Who It Is For
Energy traders
Portfolio managers
Market analysts
Technical teams
Platform
Access Hyperion your way.

Web platform

API
Excel add-in

Snowflake integration
Agentic access
With vs. Without

Without Hyperion

With Hyperion
Get Started
Trade on observed activity, not reported activity.
See market-moving oil and gas activity before it reaches lagging public data, and act on it without leaving the workflow.