

Capability
State data is
a rear-view mirror.
Production, measured before it is reported.
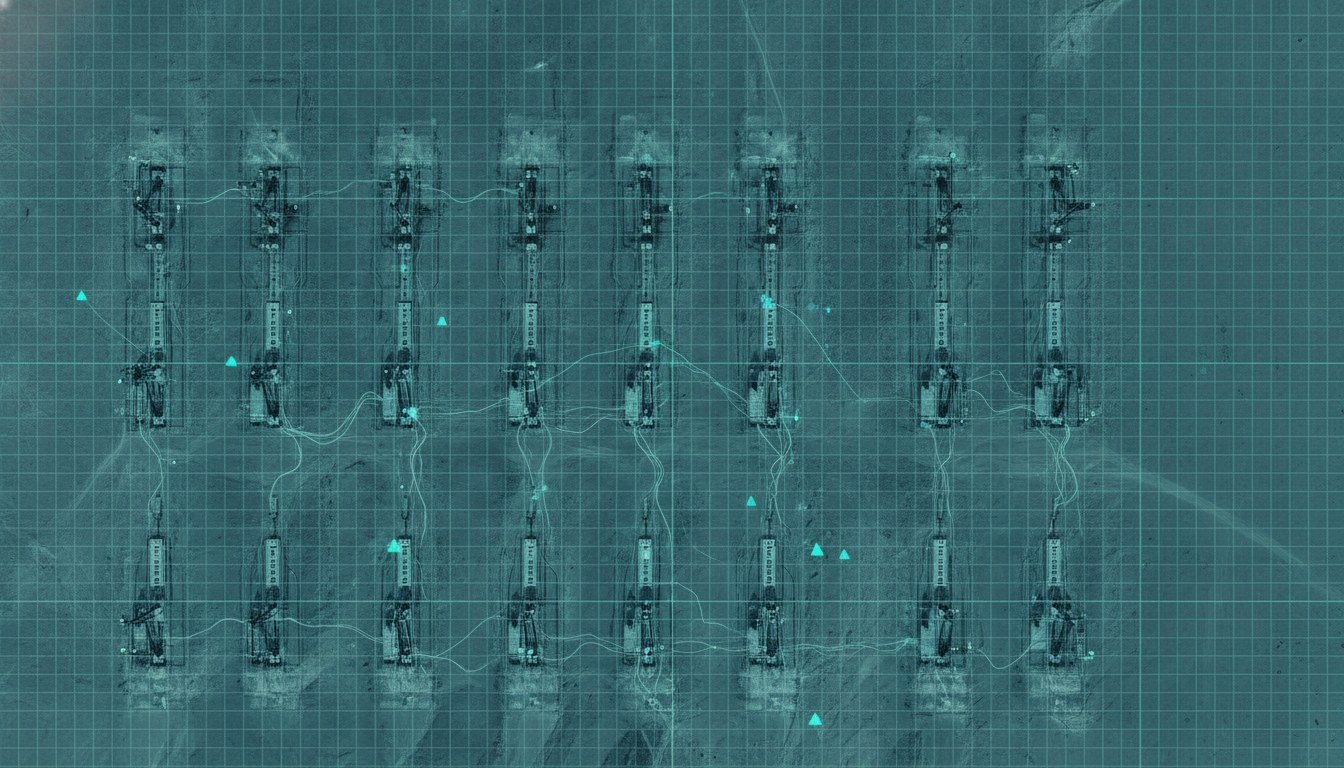
SynMax measures production from what is happening in the field, well by well, so history and forecasts update as the field changes rather than when an agency publishes. Every view, from a single well to the national number, comes from the same record.
The Problem
Late, and the same for everyone.
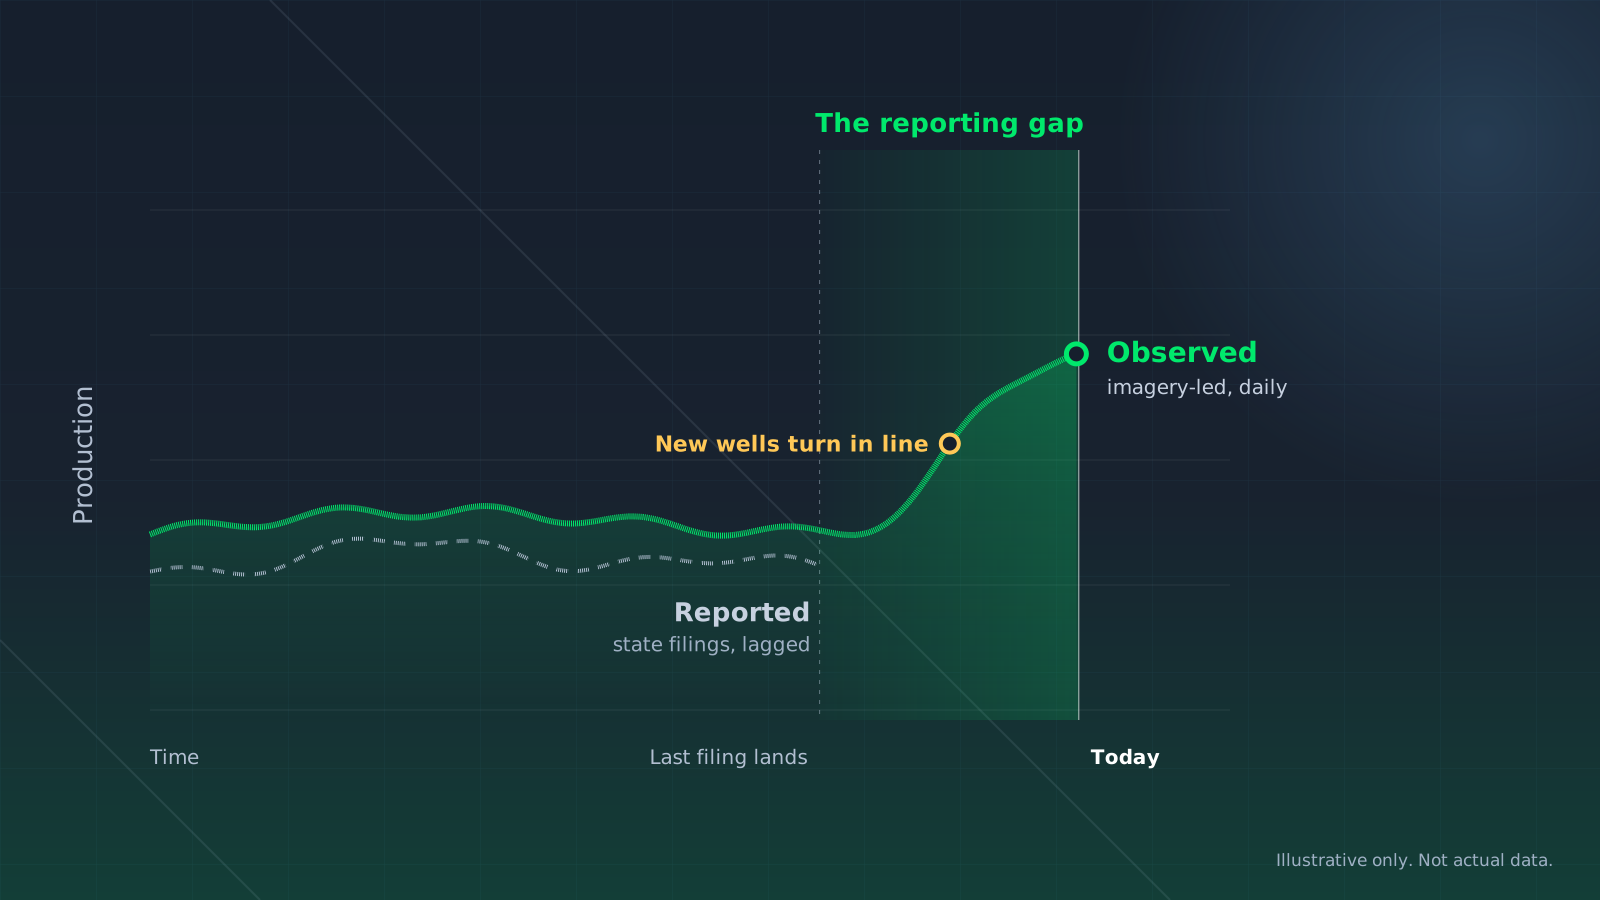
Operator filings and agency releases arrive weeks to months after the barrel moved, and they arrive for everyone at once. By the time a revision lands, the position it should have informed is already on the books.

Reported late

Incomplete at the edges

Observable now

Reconcilable
One Record
From one well to the whole country.
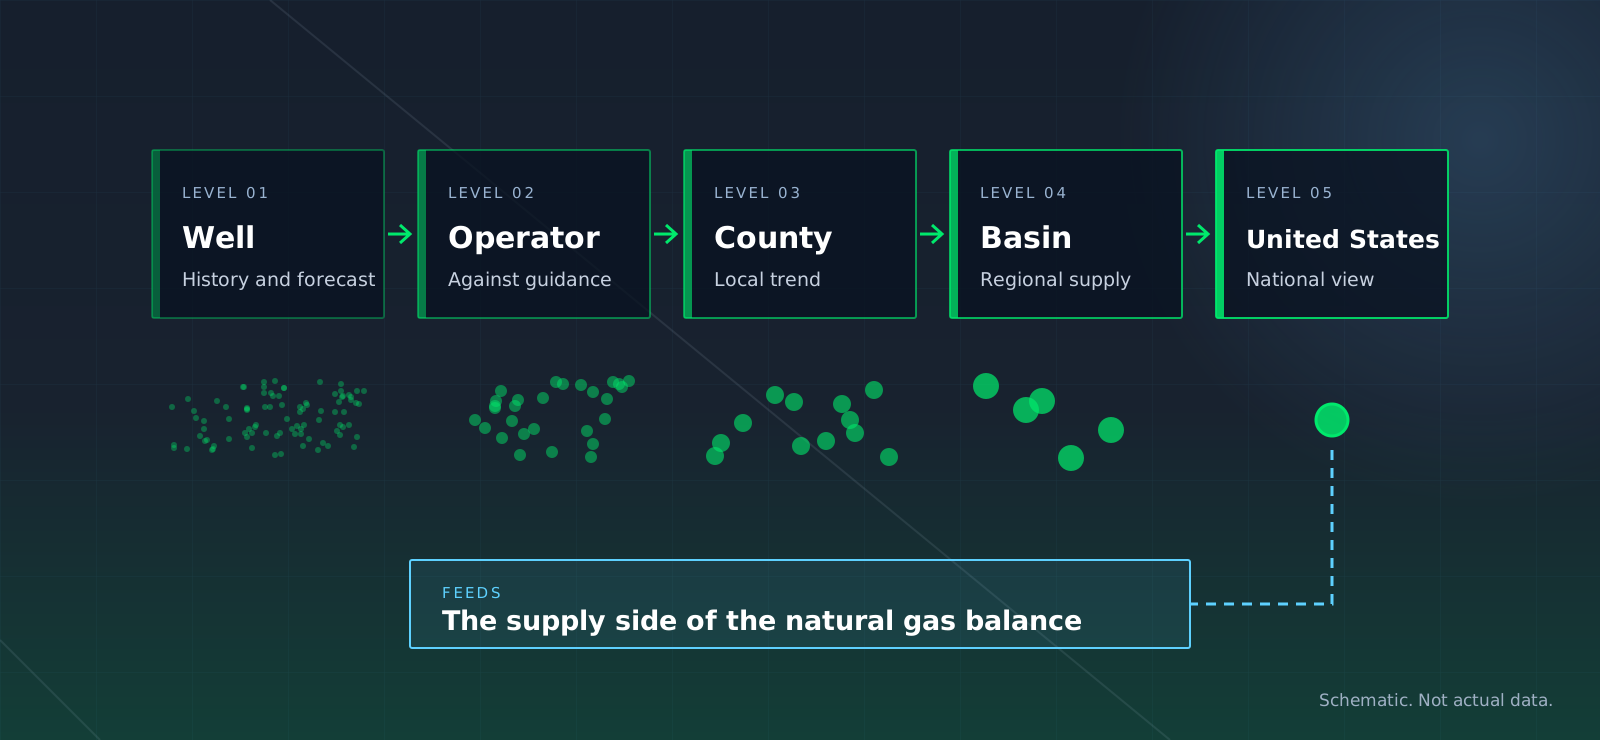
Every view starts from the same well-level record. Roll it up by operator to test guidance, by county or basin to read a trend, or all the way to the national number.
Because it is one record, the answer at every level agrees with the level below it, and the national total feeds the supply side of the gas balance.
How It Works
From the pad to the forecast.

01 / OBSERVE
Watch the asset
Daily imagery and sensing over producing acreage captures activity at the pad, tank and facility level, day or night.

02 / MODEL
Fit the curve
Observed activity is combined with well history, completion design and basin behavior to produce a well-level estimate and a forward curve.

03 / BALANCE
Roll it up
Well-level output aggregates to operator, county, basin and national views, feeding natural gas supply and demand balances.
Against Expectation
Find the wells that are falling short.
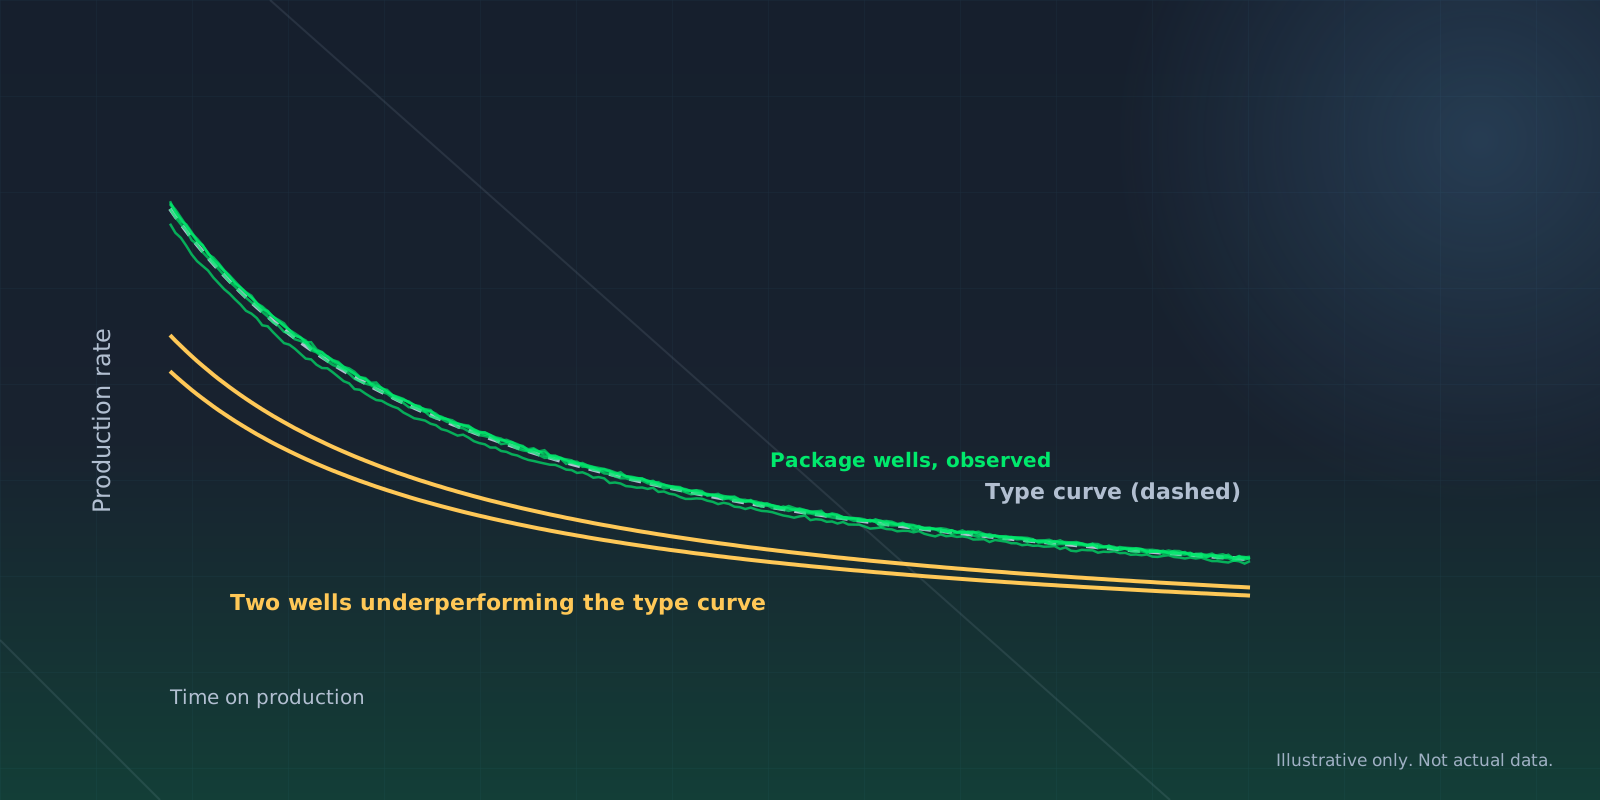
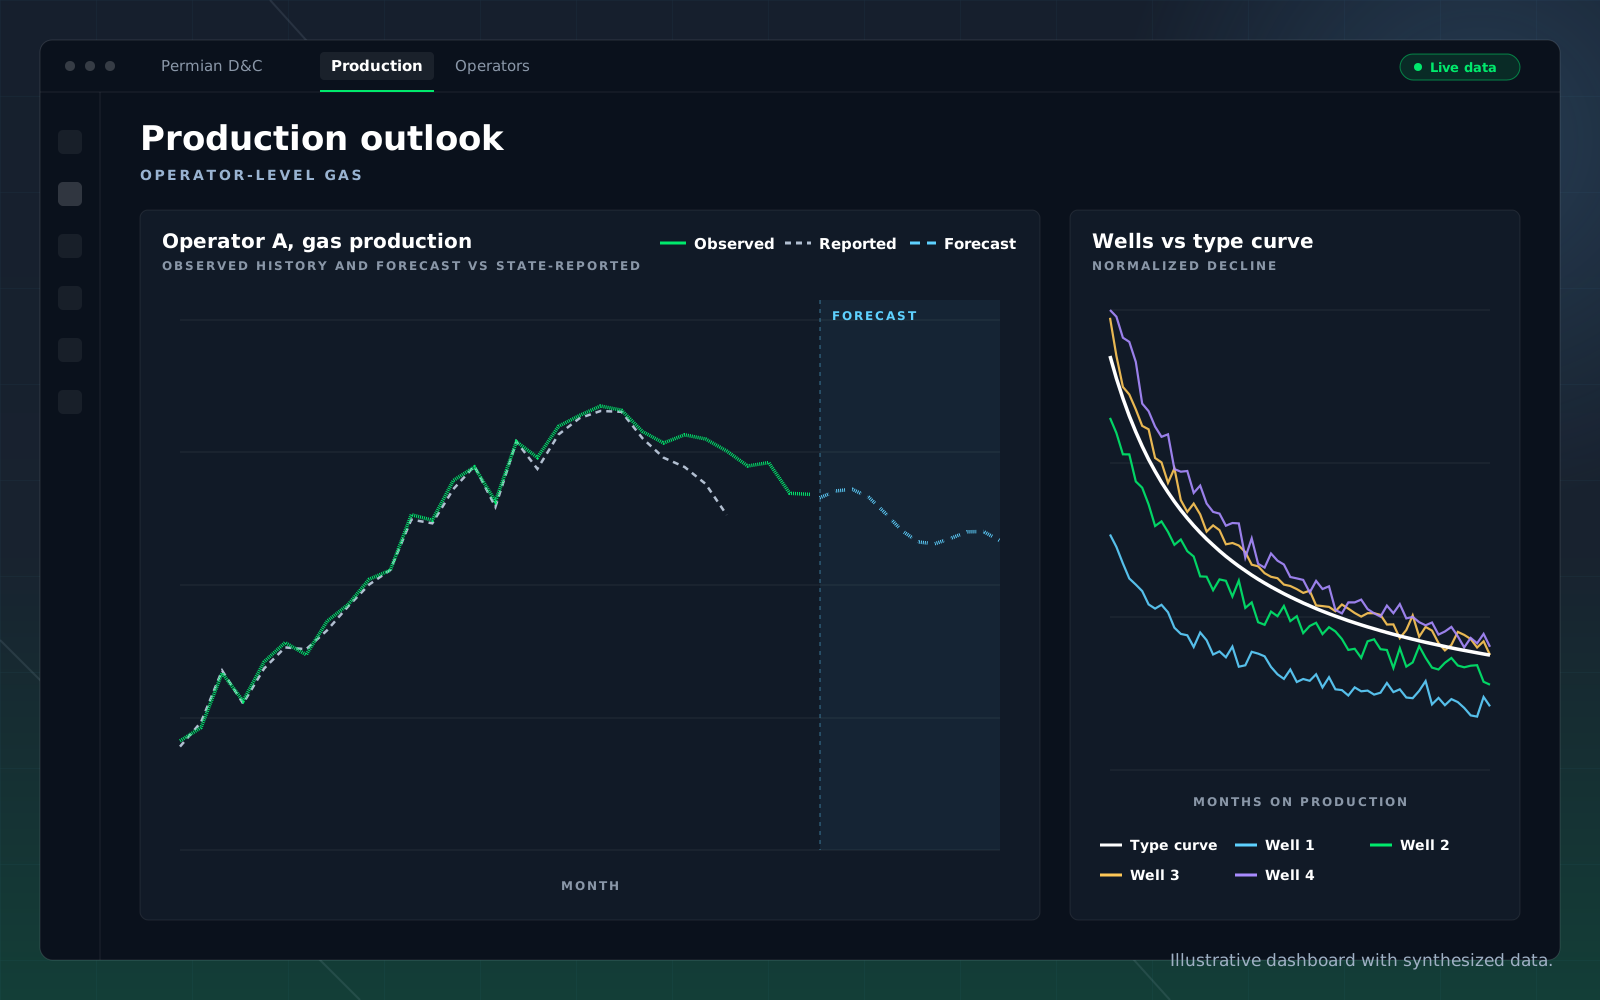
Observed production is set against each well’s type curve, so wells running below expectation stand out while there is still time to act on them.
The same view works for your own acreage, an offset operator or a package in a data room.
Coverage
What is in the data.
One record of US oil and gas production, from the individual well up to the basin and the country, observed as it happens and reconciled as filings land.
In the Platform
From the well to the forecast.
Observed history, the forecast and the reported series side by side, with every well checked against its type curve.
Pick an operator to see where its production is heading before the next filing, and which of its wells are carrying or dragging the trend.
New in Hyperion
Production is one side of the equation.
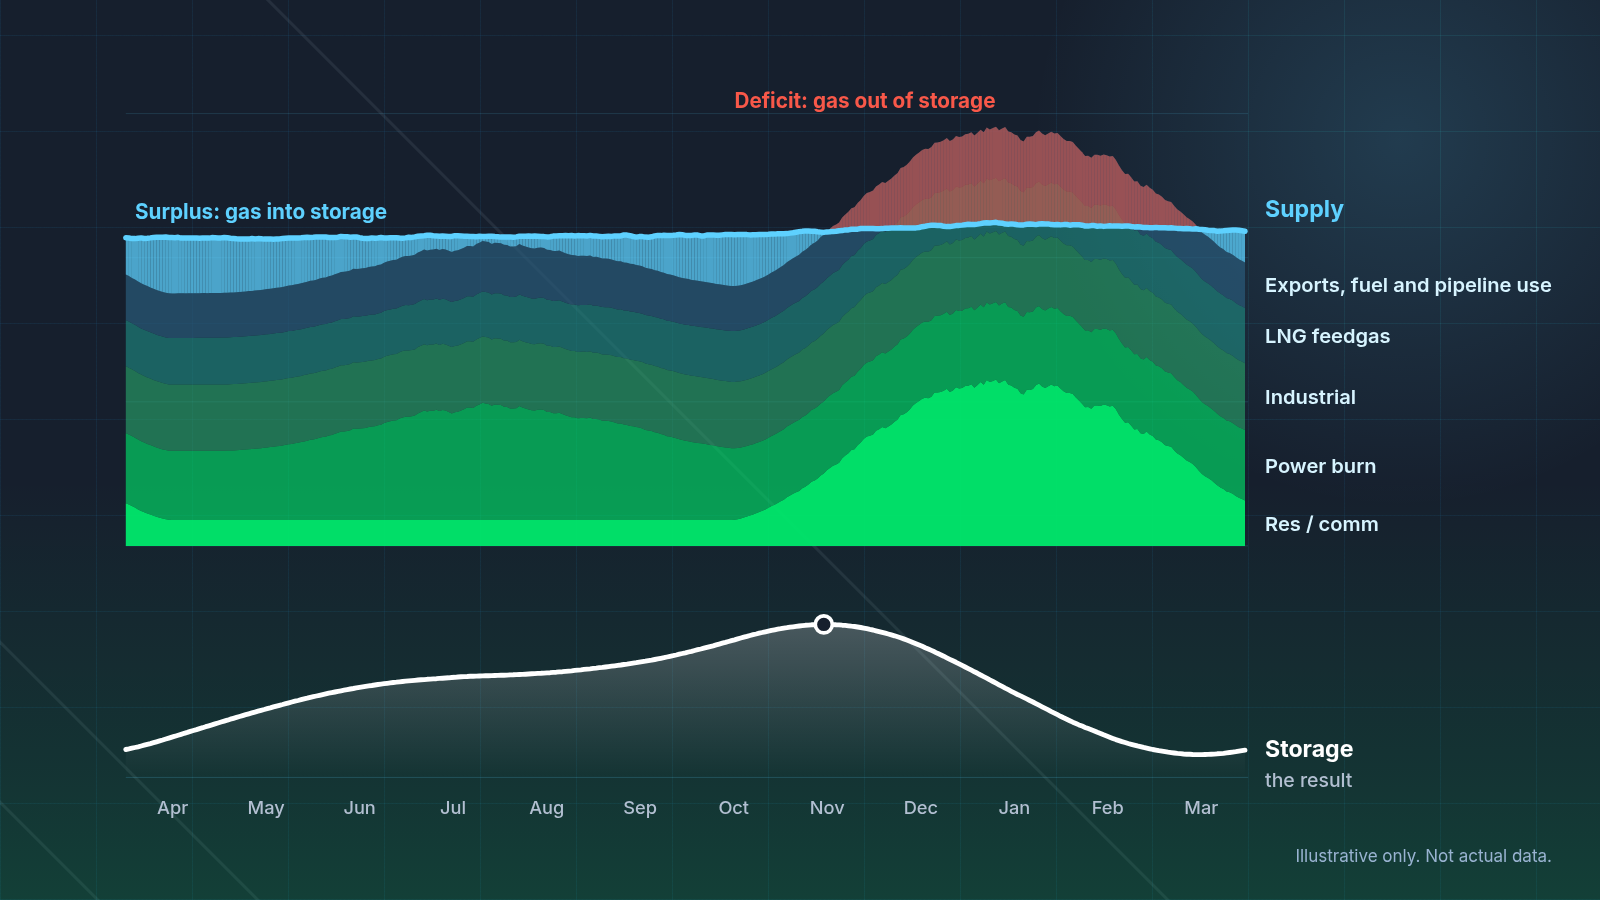
Hyperion now balances US natural gas supply against demand every day, with this production data feeding the supply side. Every demand term is modeled on its own drivers across five EIA storage regions, with daily forecasts two years forward.
Who Uses It
One record, three decisions.
The same production record answers different questions depending on the desk asking.
Trading desks

Upstream teams
Lenders and investors
Use Cases
What you can ask it.

How is this operator’s production trending against guidance?

Which basins are adding or losing supply this month?

What is the forward curve for this acreage position?

How does observed activity compare with the last filing?

Where is gas supply likely to shift before the data confirms it?
Which wells are underperforming their type curve?
FAQ
Questions buyers ask.
Where does the production data come from?
Measurement starts with satellite imagery and other sensing over producing acreage, which captures activity at the pad, tank and facility level. That observation is combined with well history and completion design, then reconciled against state filings and agency releases as they publish.
How far ahead of state data does it run?
State filings lag the wellhead by weeks to months. Observed activity enters the record as it happens, so changes such as new wells turning in line appear before the filing that confirms them.
What happens when a filing is revised?
Each filing is reconciled as it lands, so the history stays consistent instead of lurching with every revision.
Does it cover private operators?
Yes. Because measurement starts with the site rather than with disclosure, private operators, small packages and newly acquired acreage are measured on the same basis as public operators.
How do I get the data?
In the Hyperion application, through the API, as data tables for your own models, and as data sets in Atlas, the SynMax agentic platform.
How does production connect to the gas balance?
Regional production is the main supply term in the Hyperion natural gas supply and demand balance, so a change in the field carries through to the storage outlook.
Get Started
See it run on your acreage.
Bring an operator, a county or a position you track and we will show you the observed history and the forward curve next to what has been reported.