

Capability
The pipeline and the tanker,
finally one story.
Feedgas to cargo, followed end to end.
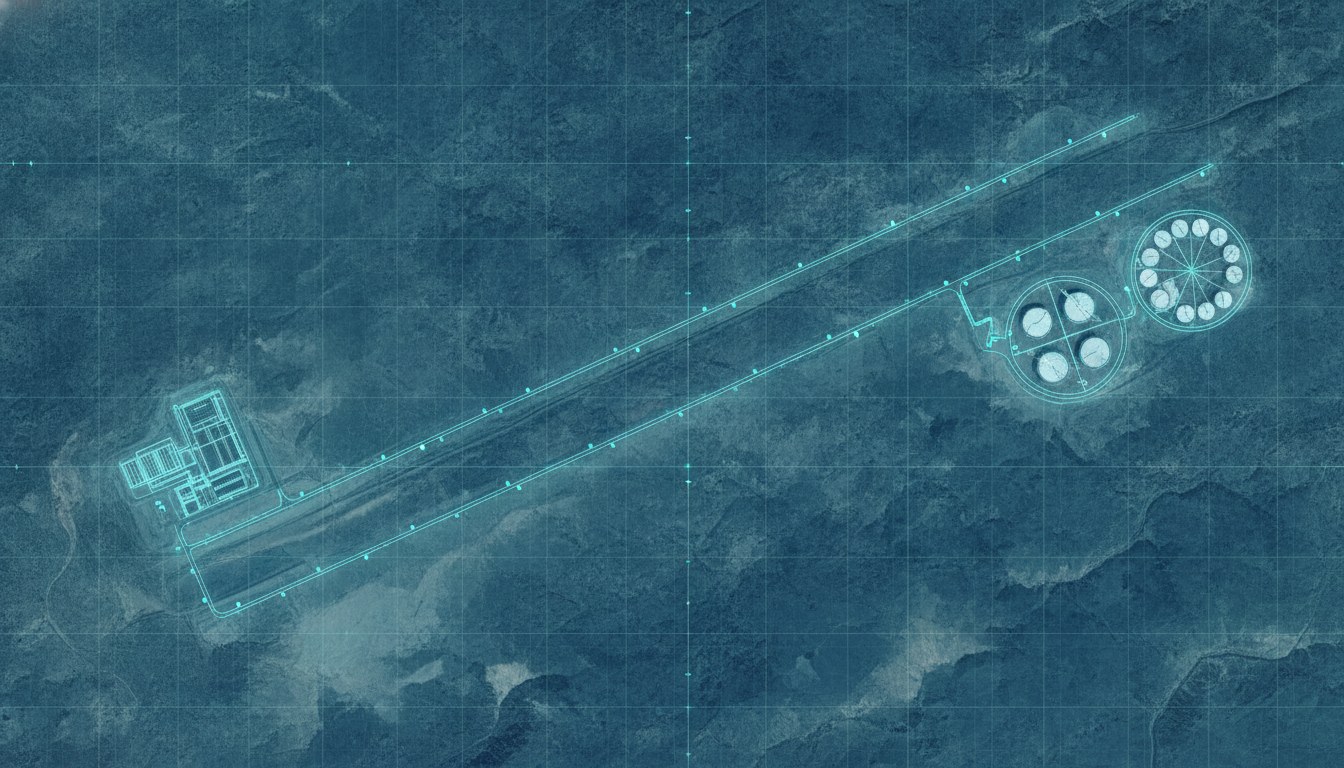
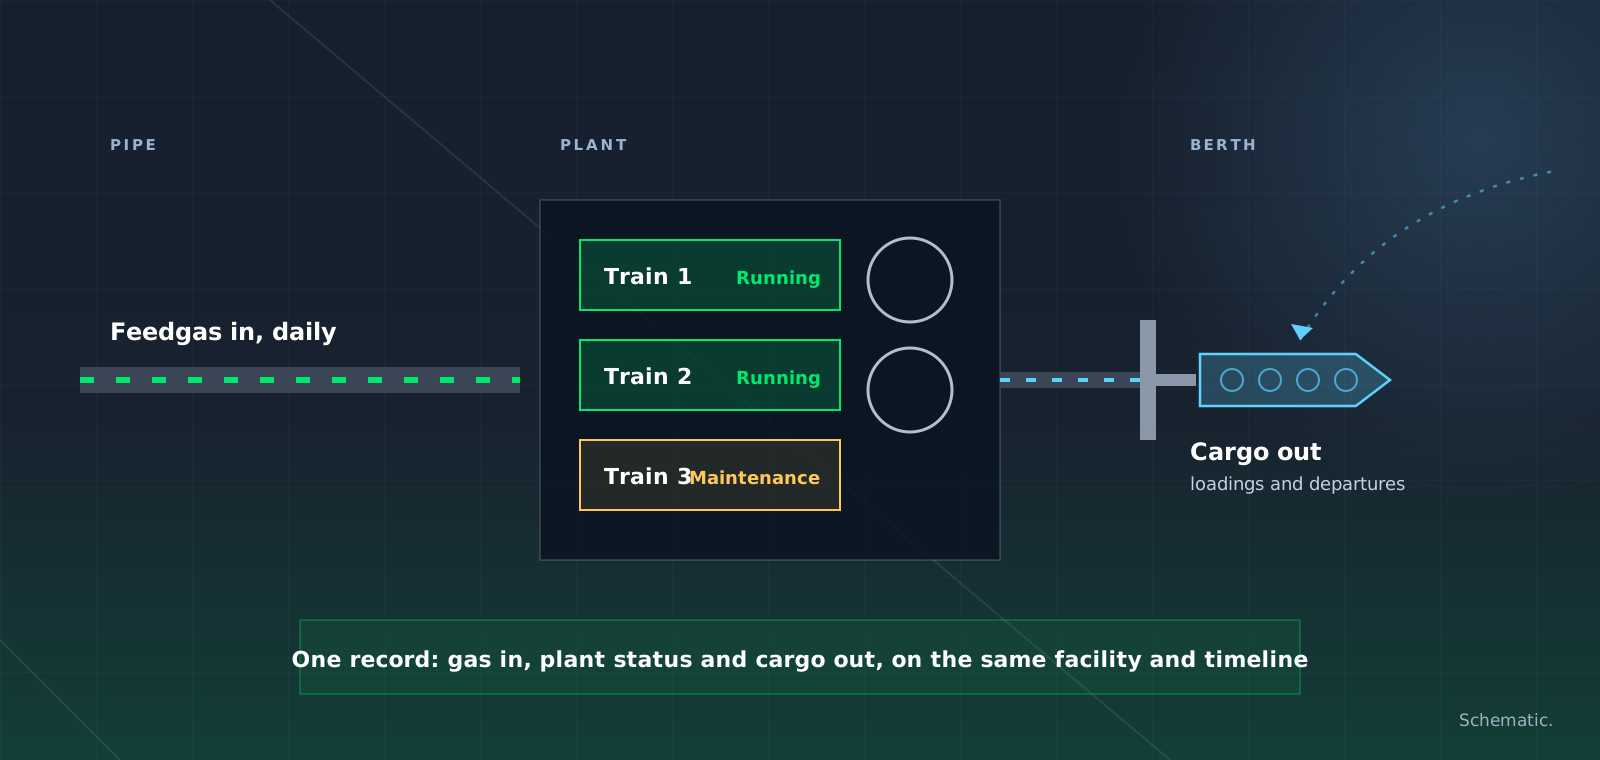
SynMax joins daily feedgas, plant status and cargo movement on one record for each facility, so a terminal running below capacity or a cargo sailing light is visible where it happens, not weeks later in two separate datasets.
The Problem
The pipeline and the tanker are usually two different stories.
Feedgas nominations tell you what a terminal intends to pull. Vessel data tells you what left. Neither on its own explains a facility running below capacity or a cargo that sails lighter than expected.

Feedgas, daily

Cargo movement

One continuous record

Global terminals
One Timeline
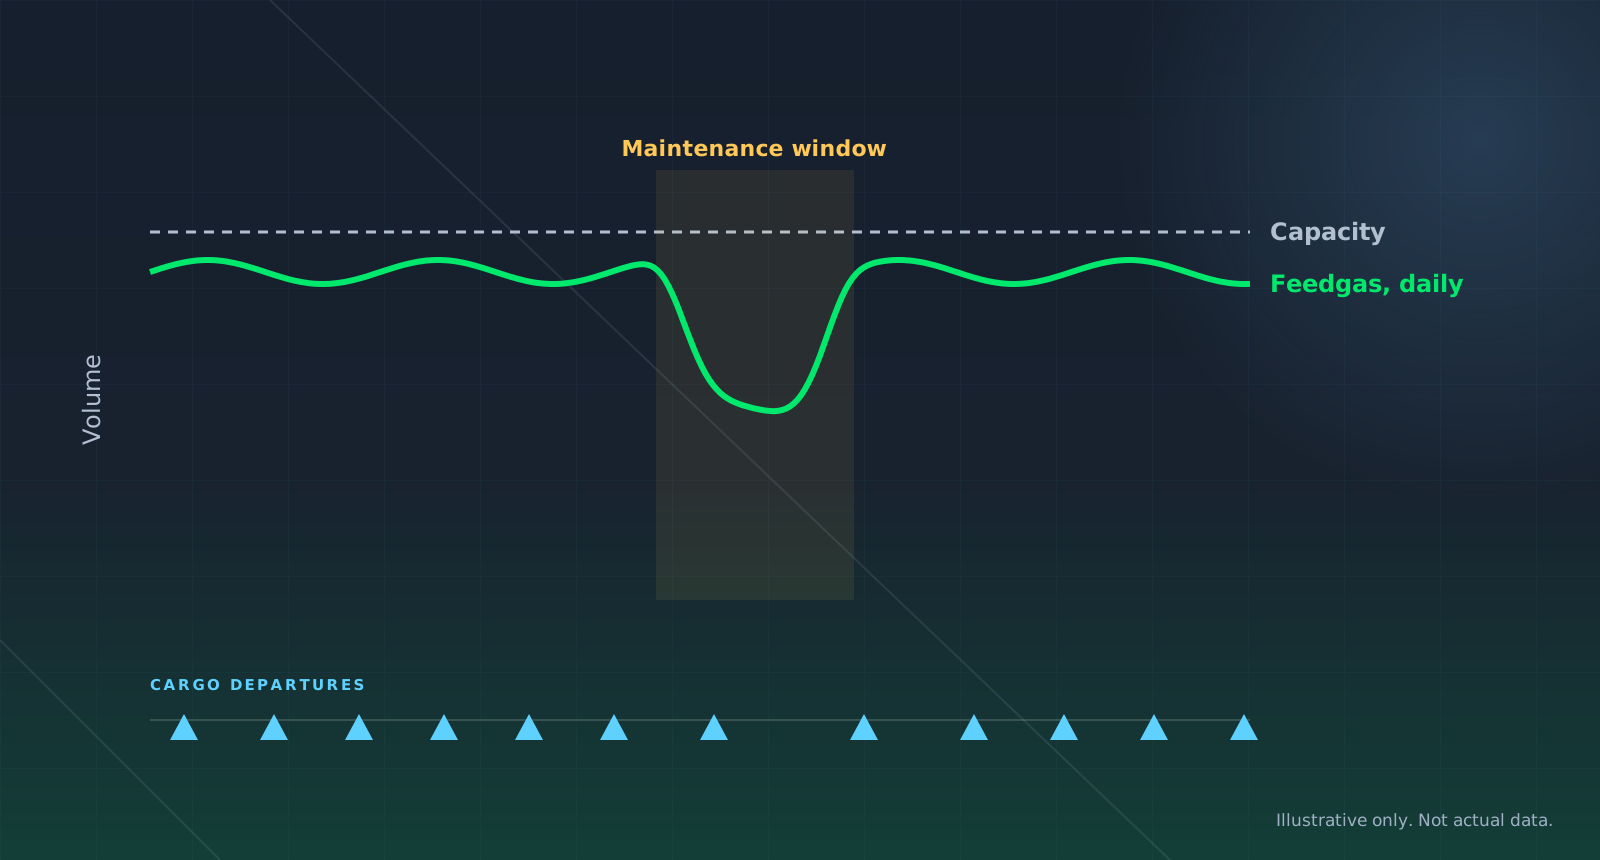
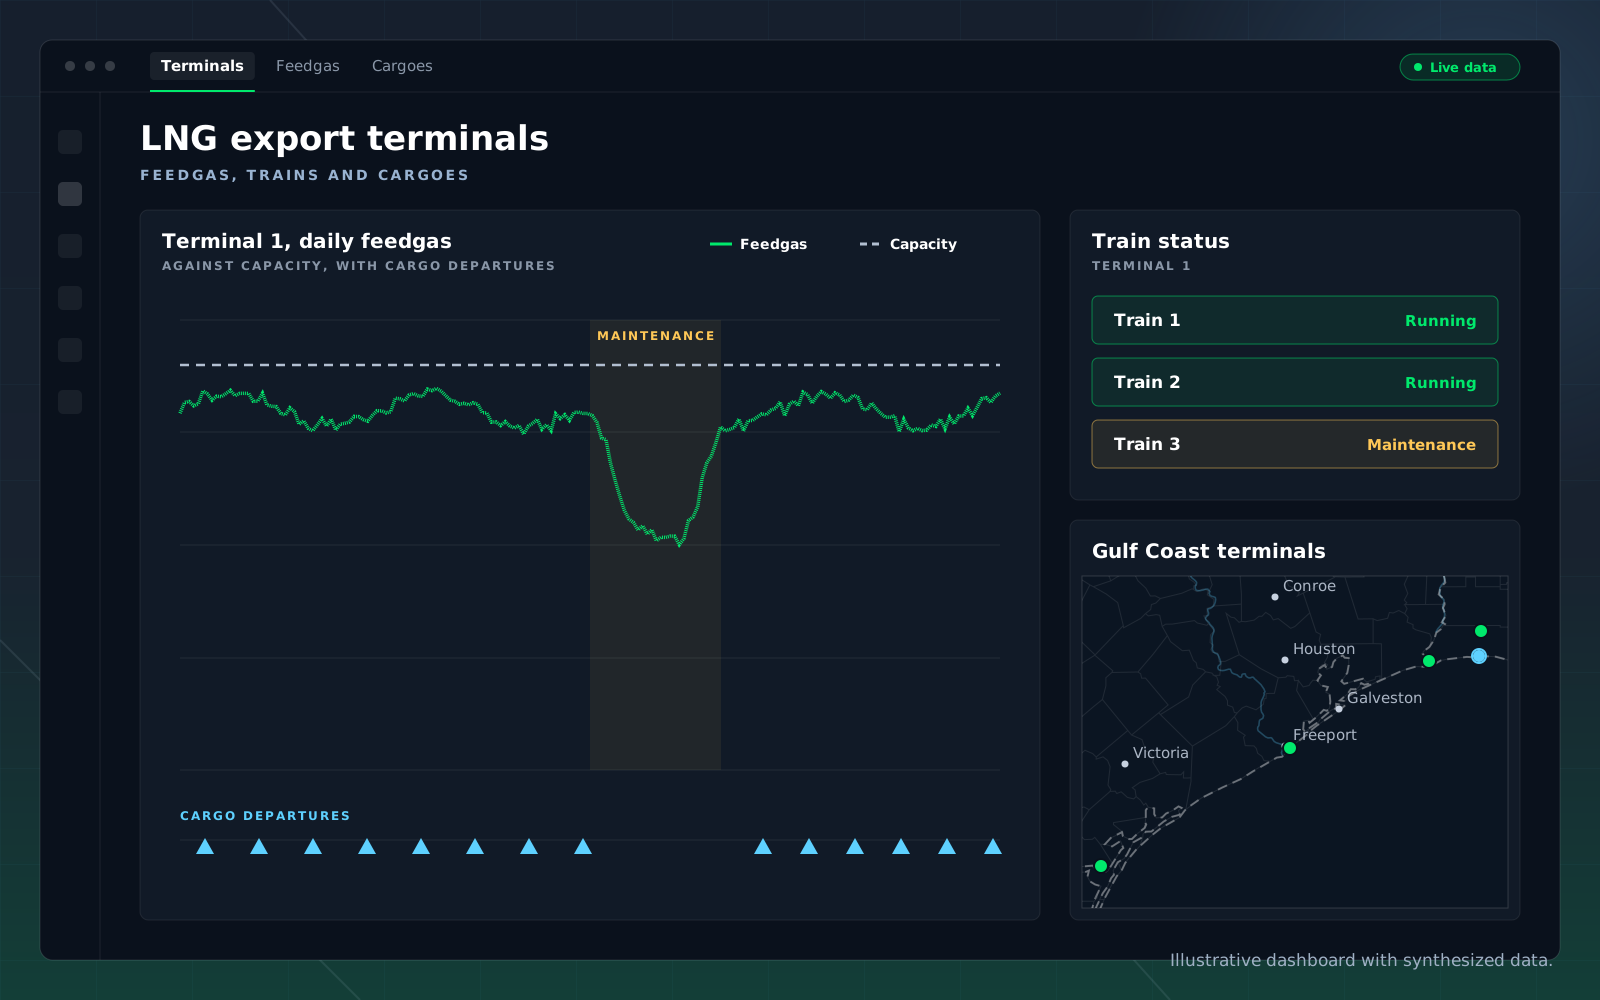
A maintenance window, seen twice.
When a train goes down, the feedgas record dips and the cargo schedule thins out. Read separately, those look like two unrelated signals. On one timeline, they are the same event.
Plant status is confirmed independently of what was nominated, so you can tell a train in maintenance from a plant that is simply pulling less.
How It Works
Pipe, plant, ship.
01 / FEEDGAS
Measure the intake
Daily pipeline deliveries into each liquefaction facility establish what the plant is actually pulling.

02 / FACILITY
Watch the plant
Imagery and thermal signal confirm whether trains are running, in maintenance, or down, independent of what was nominated.
03 / CARGO
Follow the ship
Loadings and departures are tracked from the berth so volume out can be set against gas in.
Both Ends of the Trade
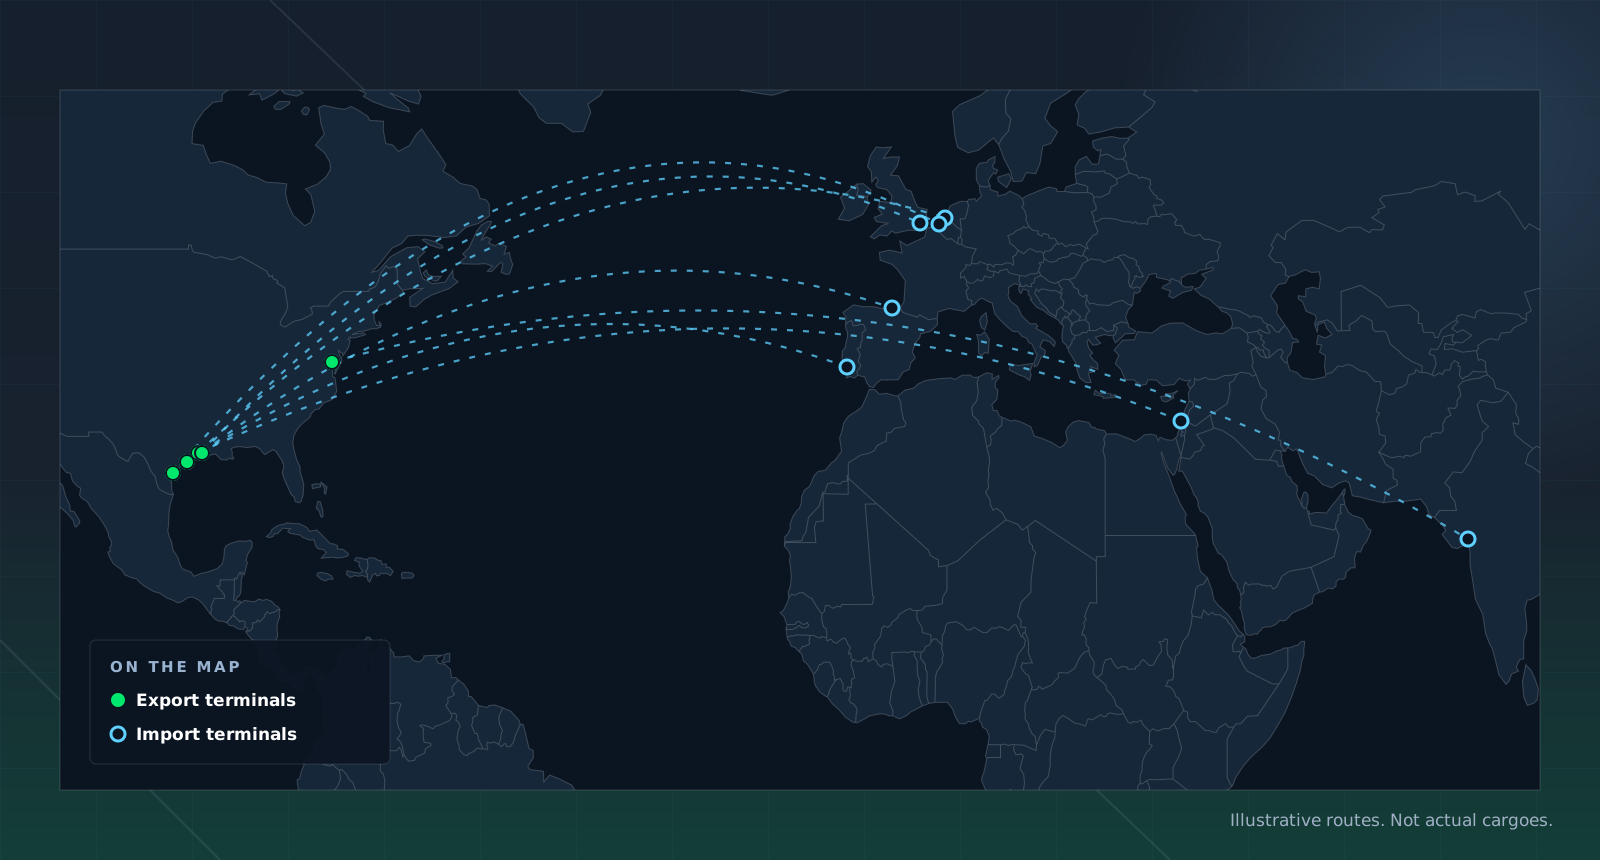
Follow the cargo, not just the terminal.
Export and import facilities are covered on the same basis, so a cargo can be read from the berth where it loaded to the terminal where it arrives.
That closes the loop on the questions that matter commercially: where volume from a facility is actually going, and how this week compares with the same week last year.
Coverage
What is in the record.
Every stage of an LNG facility, from the pipe to the ship, tied to the same terminal and period.
In the Platform
Every terminal, end to end.
Feedgas against capacity, train status and cargo departures for each terminal, on one timeline.
Pick a terminal to see what it is pulling, which trains are running and what has sailed, with every Gulf Coast facility on the map beside it.
In the Balance
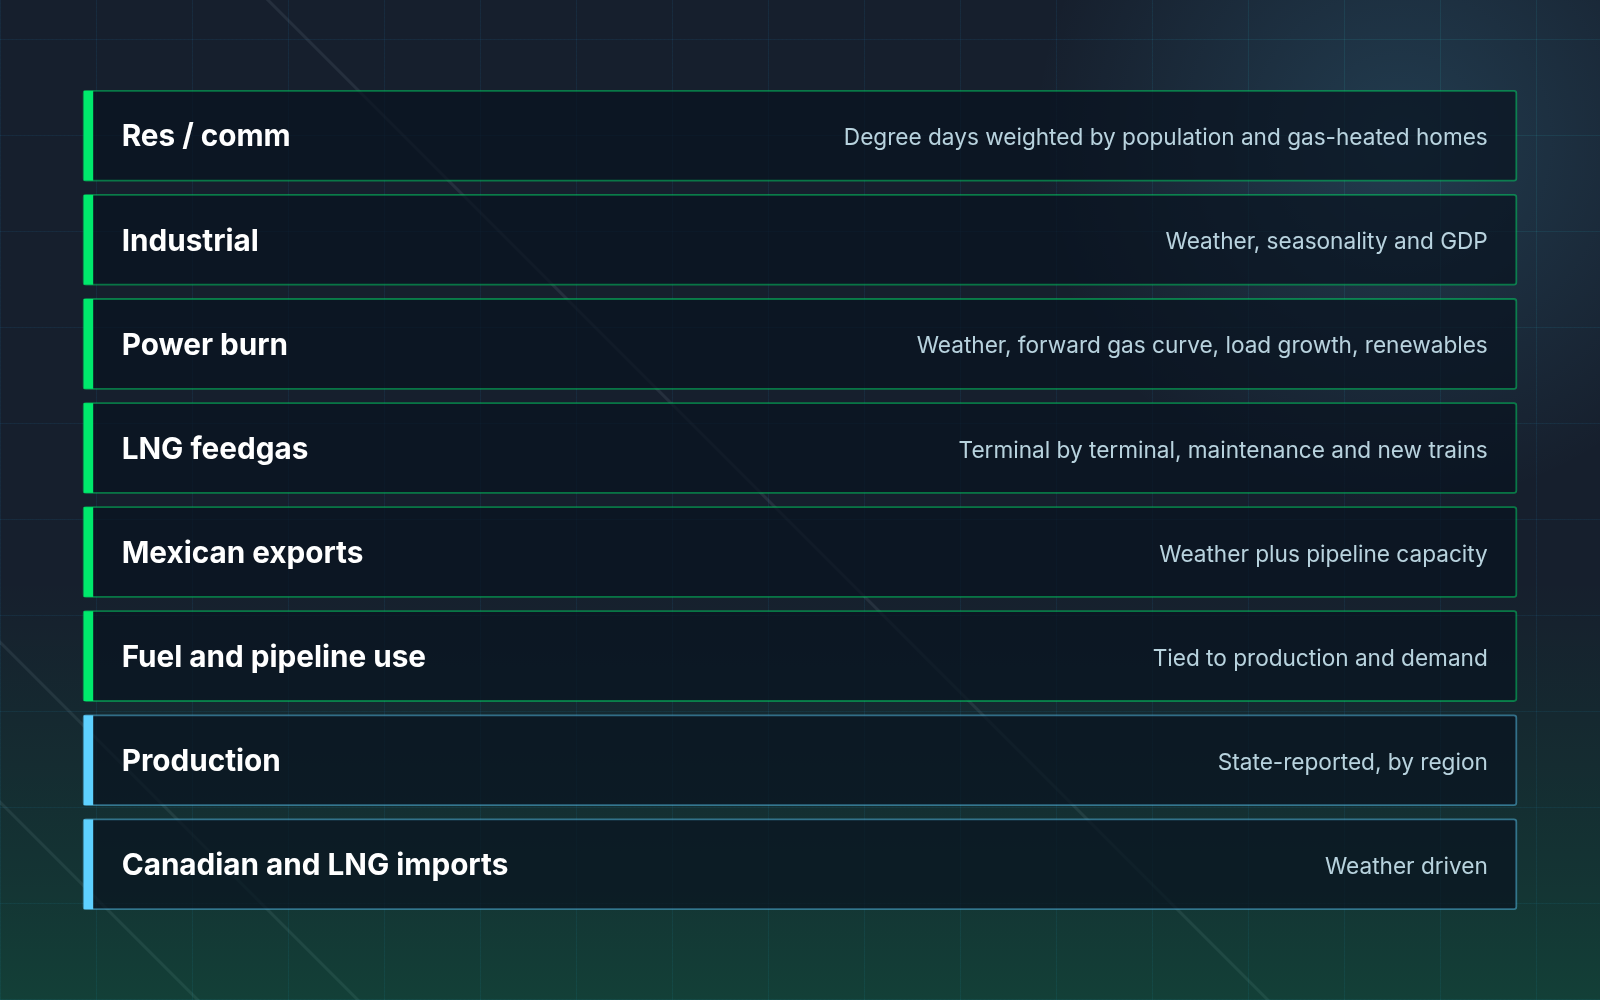
Feedgas is a term in the gas balance.
LNG feedgas by terminal is one of the demand terms in the Hyperion supply and demand balance. Known maintenance is built in ahead of time, and new trains are tracked with satellite imagery and regulatory filings, so start dates follow what is happening on site.
Who Uses It
One record, three decisions.
The same terminal record answers different questions depending on the desk asking.

Gas and LNG traders
Terminal and midstream operators

Supply analysts
Use Cases
What you can ask it.
What is daily feedgas demand at this terminal?
Is this facility running all trains, or is one down?
How many cargoes have loaded here this month?
Where are cargoes from this terminal actually going?
How does current feedgas compare with the same week last year?

Did the maintenance window end when it was supposed to?
FAQ
Questions buyers ask.
How is feedgas measured?
From daily pipeline deliveries into each liquefaction facility, which establish what the plant is actually pulling rather than what was nominated.
How do you know when a train is down?
Imagery and thermal signal confirm whether each train is running, in maintenance or down, independent of what the operator nominated.
Do you track where cargoes go?
Yes. Loadings and departures are followed from the berth, so volume out can be set against gas in and cargoes can be followed to where they actually go.
Are import terminals covered?
Yes. Export and import facilities are covered on the same basis, so flows can be read at both ends of a trade.
How does this connect to the gas balance?
LNG feedgas by terminal is one of the demand terms in the Hyperion supply and demand balance, with known maintenance and new trains built in.
How do I get the data?
In the platform, through agents, by API, in Snowflake or in Excel, so the answer arrives in the system your team already uses.
Get Started
Close the loop on a terminal you follow.
Name an export facility and we will show you its feedgas record next to its cargo history, on the same timeline.