


Capability
An announcement
is not a project.
Which projects are real, and when they finish.
SynMax watches each announced project from groundbreaking to commissioning, so you know which are real, which have stalled and when each is likely to come online. The completion date moves when the site does, not when a press release is revised.
The Problem
Developer timelines carry an incentive.
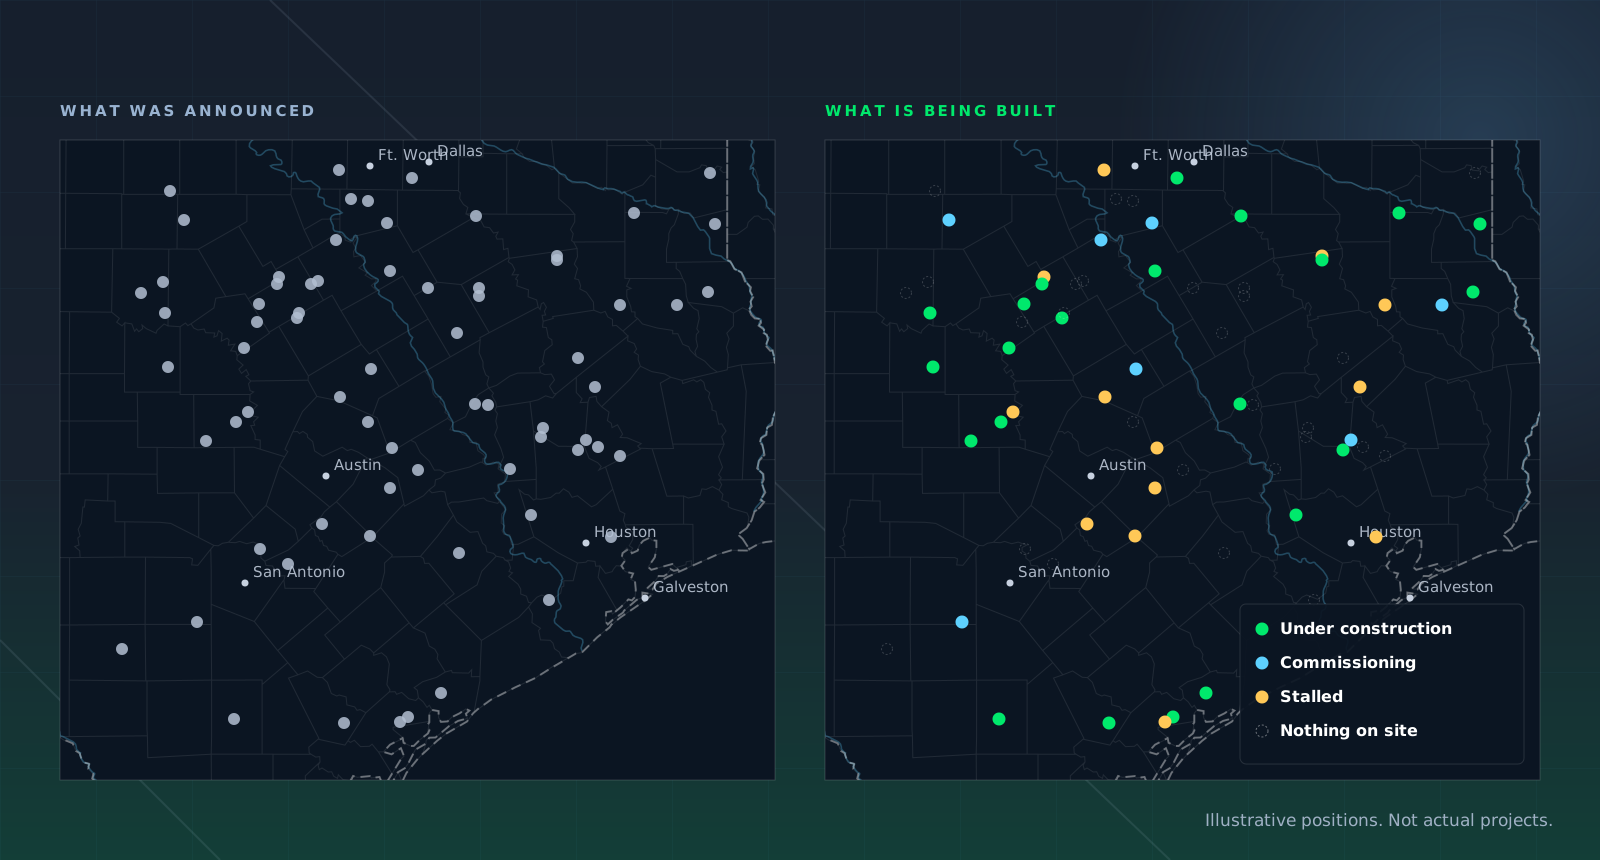
Developer timelines are forecasts with an incentive attached. A meaningful share of announced capacity never breaks ground, and much of what does arrives late, but the public record rarely says so until long after.

Announced is not started

Delay shows up early

Progress is continuous

Verified against the record
From Paper to Ground
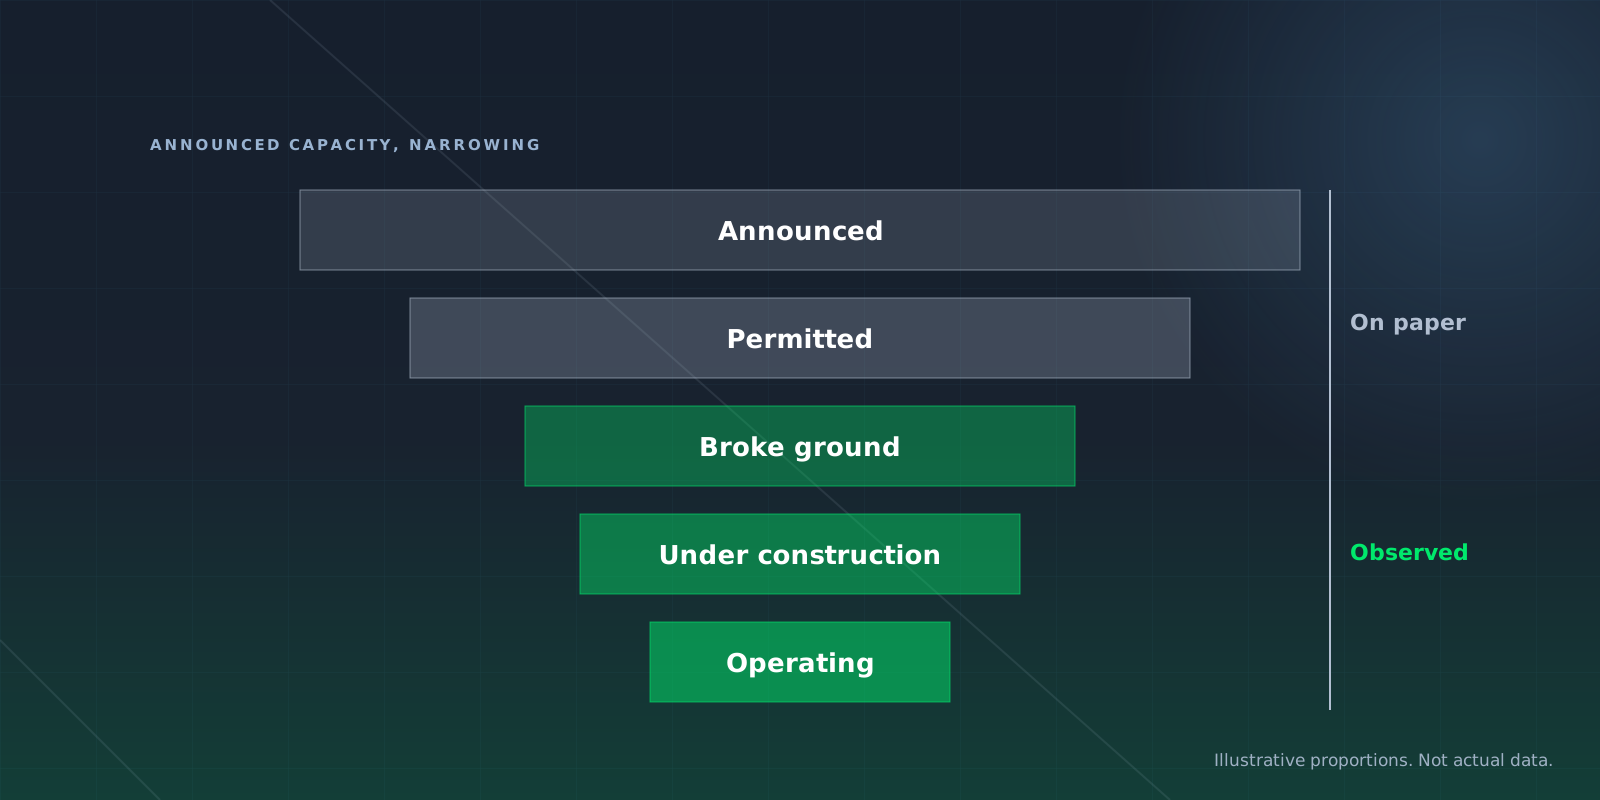
Much of the pipeline is paper.
Every capacity model starts with a list of announced projects. Permits, press releases and queue positions all add to that list, and none of them move dirt. The list shrinks at every stage between the announcement and the day a project runs.
Observation shows where each project actually sits, so the capacity you plan around is the capacity that is being built.
How It Works
Ground truth, stage by stage.

01 / LOCATE
Find the site
Announced projects are matched to coordinates so the right patch of ground is under observation from the start.

02 / TRACK
Watch it build
Repeat imagery marks each construction stage, from clearing and foundations through structures and equipment.
03 / ESTIMATE
Call the date
Observed progress against comparable builds produces a completion estimate that updates as the site does.
Early Warning
A stalled site looks stalled from above.
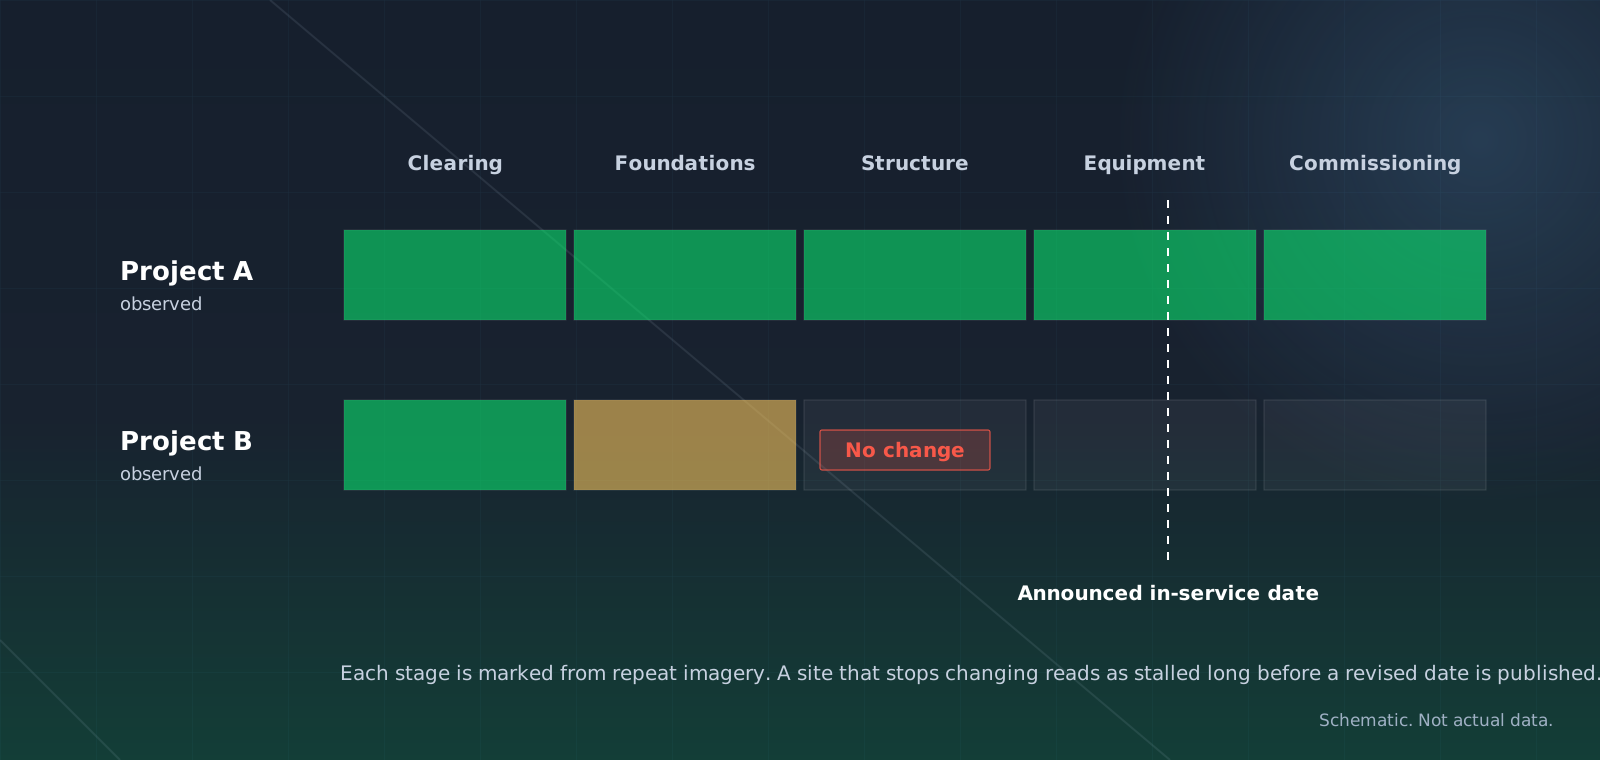
Developers rarely announce a delay until they have to. On the ground, the signs come much earlier: clearing that stops, foundations that sit untouched, equipment that never arrives.
Each stage is marked as it happens and compared with comparable builds, so a completion estimate changes as the site does. A project that stops changing reads as delayed months before a revised date is published.
Coverage
What is in the record.
Each announced project, located, watched stage by stage and given a completion date that moves with the site.
In the Platform
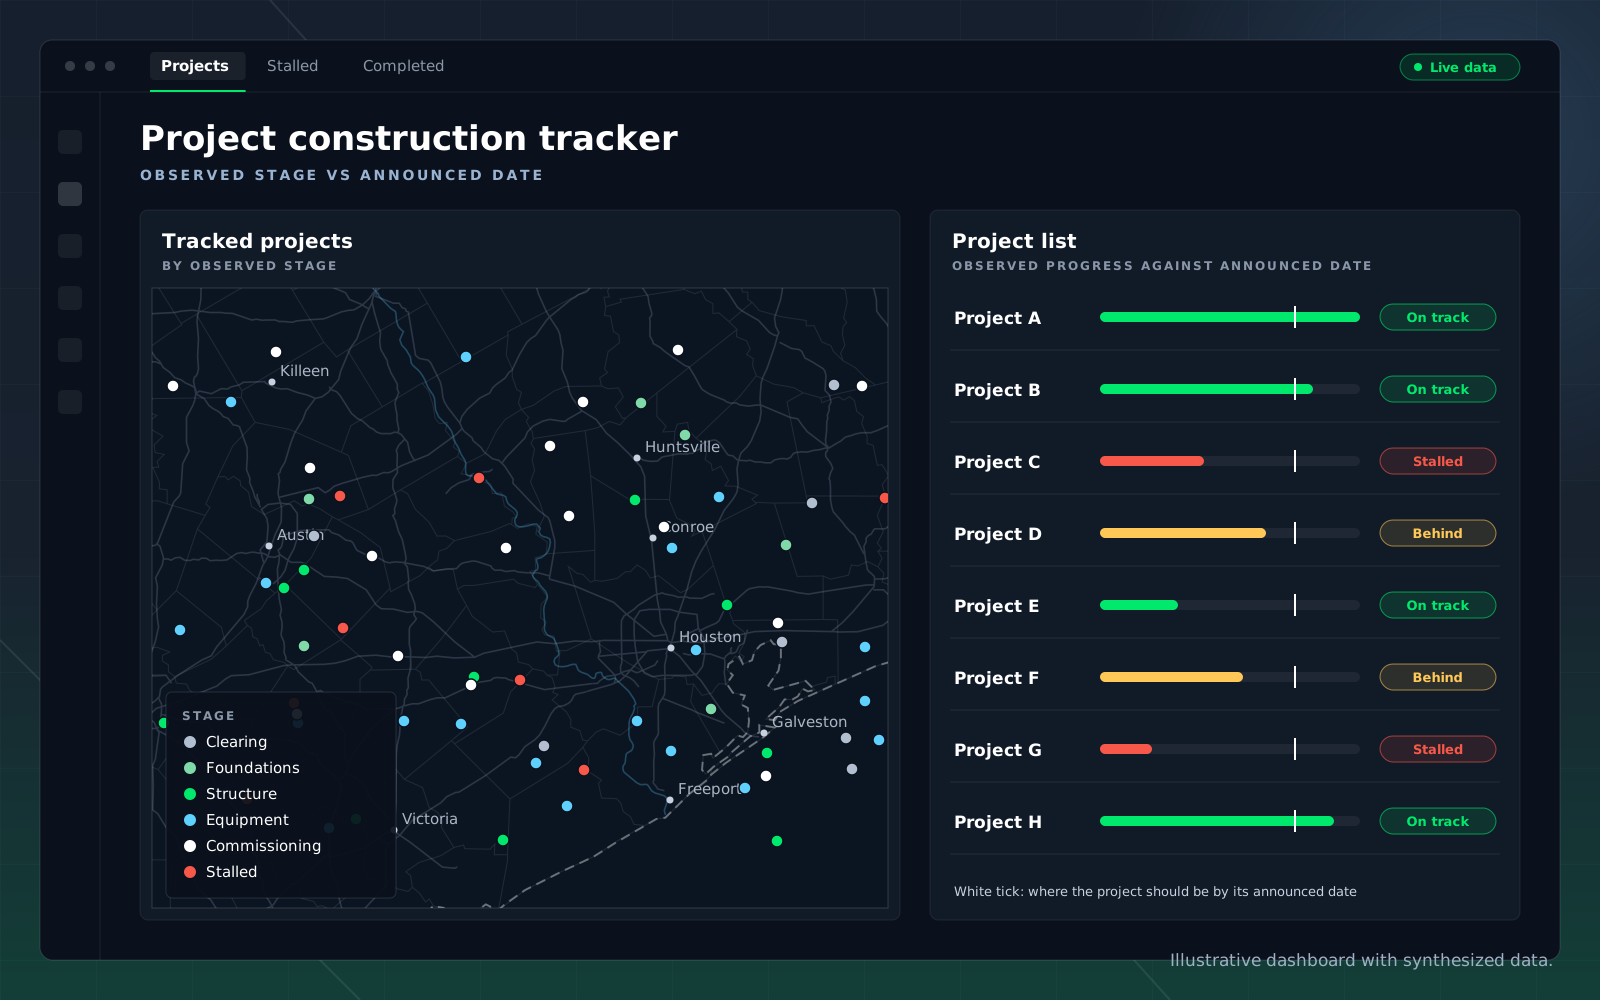
Every project, by stage.
Each tracked project on the map, with its observed stage set against the announced date.
The list shows which projects are on schedule, behind or stalled, and the map shows where each one sits, so a capacity question and a location question have the same answer.
Who Uses It
One record, three decisions.
The same construction record answers different questions depending on the desk asking.

Utilities and grid planners

Power and gas traders

Lenders and investors
Use Cases
What you can ask it.

Which announced projects have actually broken ground?
Which projects look stalled or delayed?
What changed at this facility after the weather event?
When is this project likely to come online?

How does observed progress compare with the published schedule?

Which projects should be in our capacity model this year?
FAQ
Questions buyers ask.
What counts as breaking ground?
Observed change on the site itself, such as clearing and foundations. A permit and a press release do not count.
How is the completion estimate made?
Observed progress is compared with comparable builds. The estimate updates as the site changes, not when a developer revises a schedule.
How early does a delay show?
A stalled site looks stalled from above months before a revised date is published.
Which projects are covered?
Announced energy projects, including power generation and large-load sites such as data centers.
Can I check a site after a storm or outage?
Yes. Repeat imagery shows what changed at a facility after a weather event.
How do I get the data?
In the platform, through agents, by API, in Snowflake or in Excel, so the answer arrives in the system your team already uses.
Get Started
Test it against a project you already know.
Pick a build you track closely and we will show you the observed construction record and the completion estimate next to the announced date.