

Capability
The queue
is not the grid.
Power and data centers, tracked through the build.
SynMax follows generation and large-load sites through construction and into operation, so capacity models rest on what is being built and energized, not on what was announced three years ago.
The Problem
Load is arriving faster than the record of it.
Data center announcements and interconnection queues both overstate what will exist. Planners need to know which sites are energizing and when, and the difference decides whether a region is short.

Large load, new behavior

Generation in step

Queues overstate

Energization is visible
Real or Speculative
Separate the queue from the build.
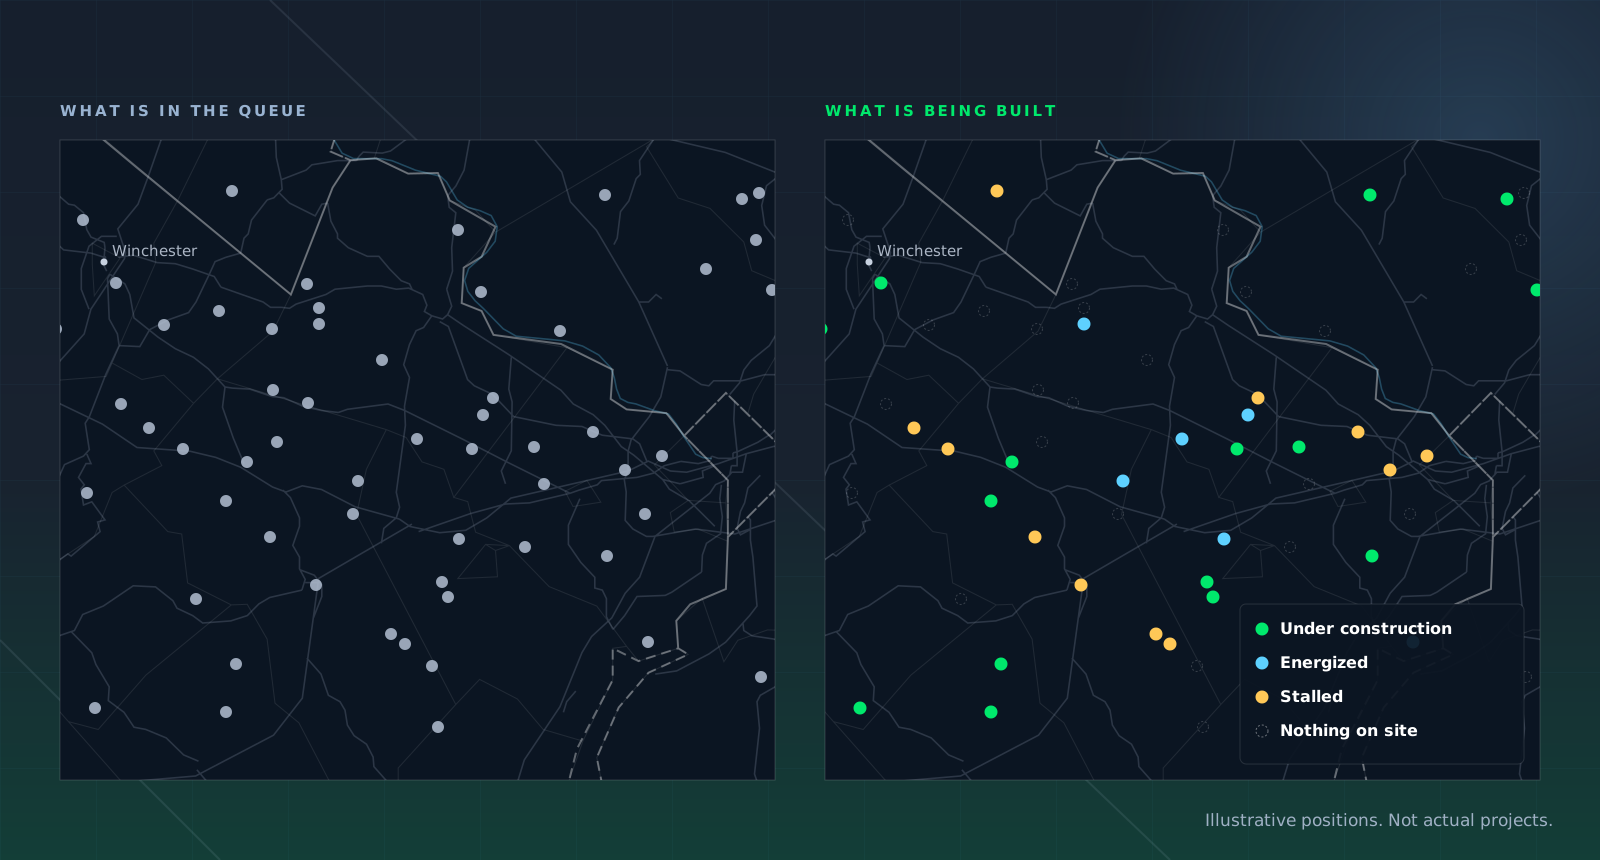
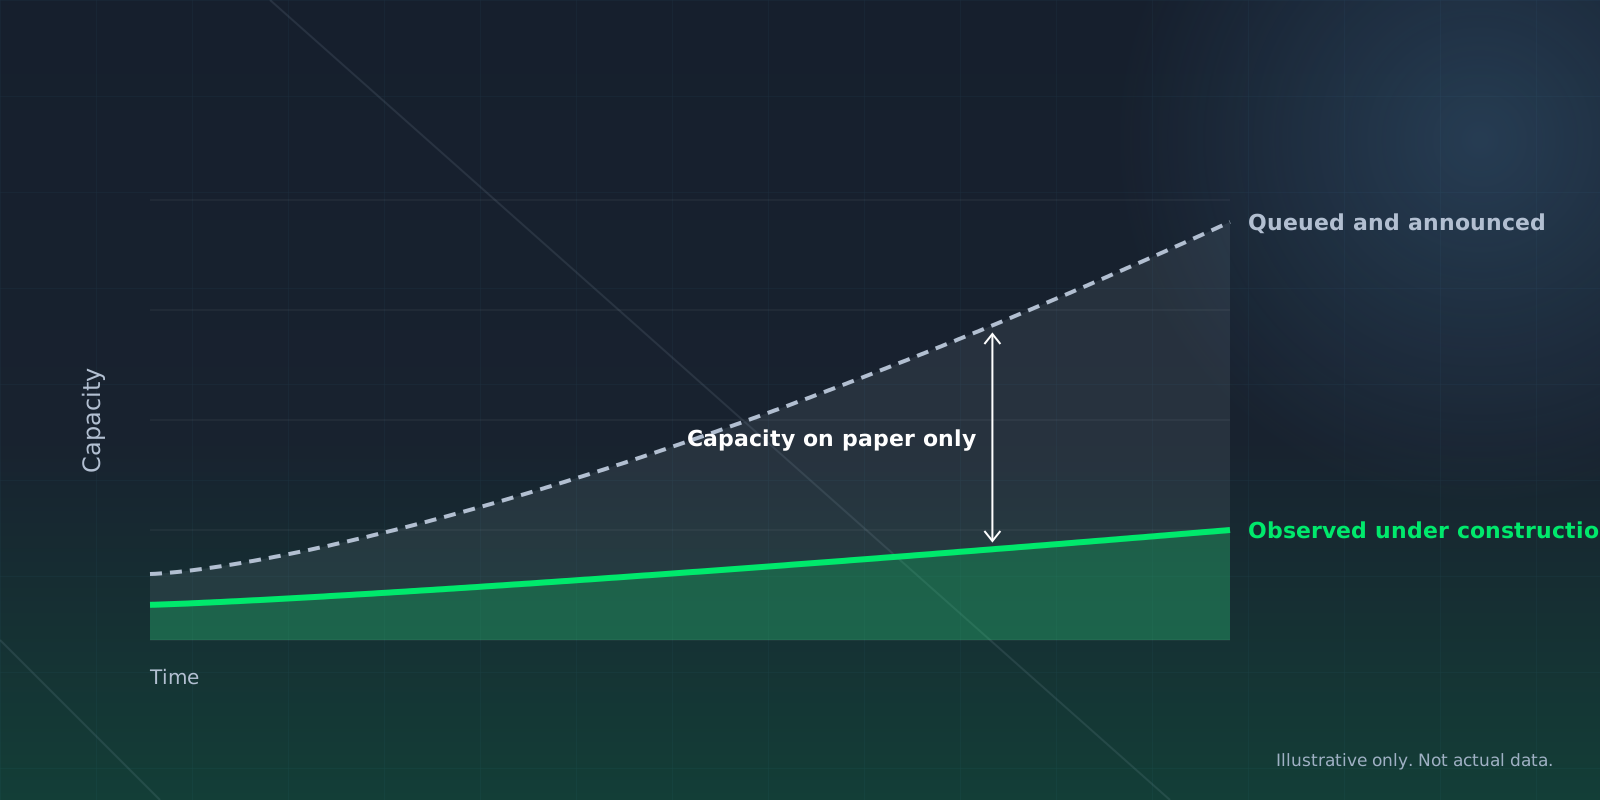
Interconnection queues contain far more capacity than will ever be built. Treating them as a forecast means planning around projects that exist only on paper.
Each project is checked against what is happening on site, so a region’s new capacity splits cleanly into what is under construction, what has stalled and what has not started.
How It Works
From dirt to draw.

01 / BUILD
Follow construction
Sites are tracked through clearing, foundations, structure and equipment installation across generation and large-load projects.
02 / ENERGIZE
Catch the switch
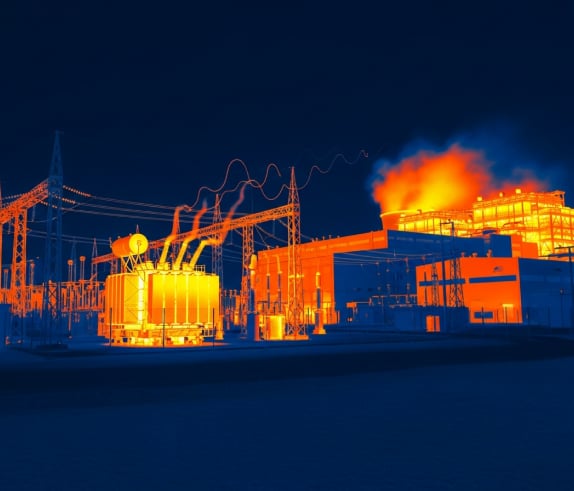
Thermal and activity signatures mark the transition from construction to operating, often ahead of the public record.

03 / MODEL
Feed the forecast
Observed stage and timing feed capacity models so regional supply and demand reflect what will actually be on the system.
Load on Its Own Curve
Data centers ramp differently.
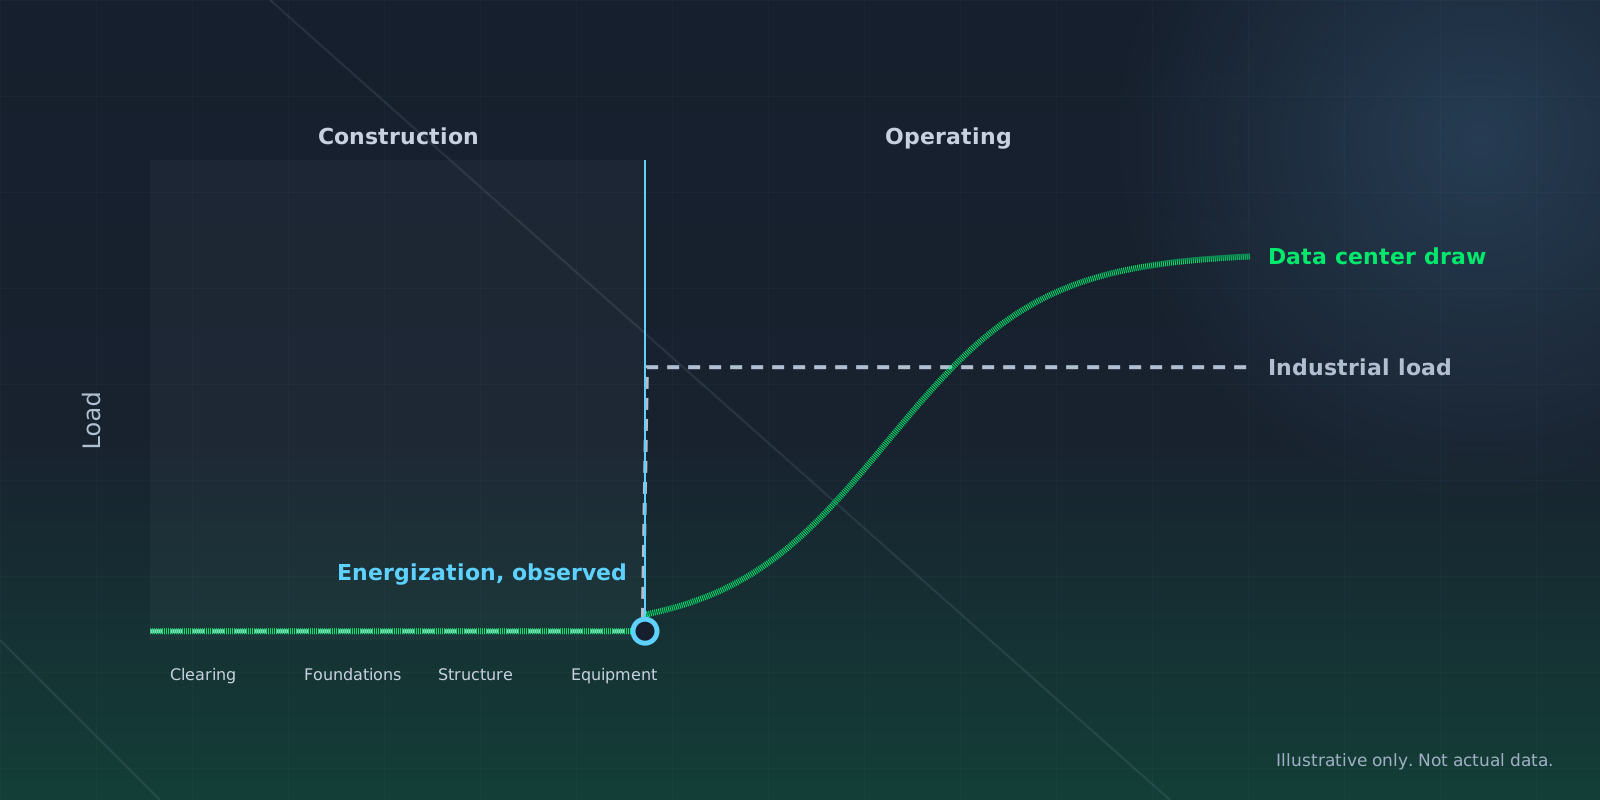
A data center does not reach full draw the day it energizes. It ramps on its own curve, unlike industrial load, and its build stage says where on that curve a site sits.
Energization is marked from activity on site, often ahead of the public record, so regional supply and demand reflect what will actually be on the system.
Coverage
What is in the record.
Generation and large load, tracked on the same basis from construction to operation.
In the Platform
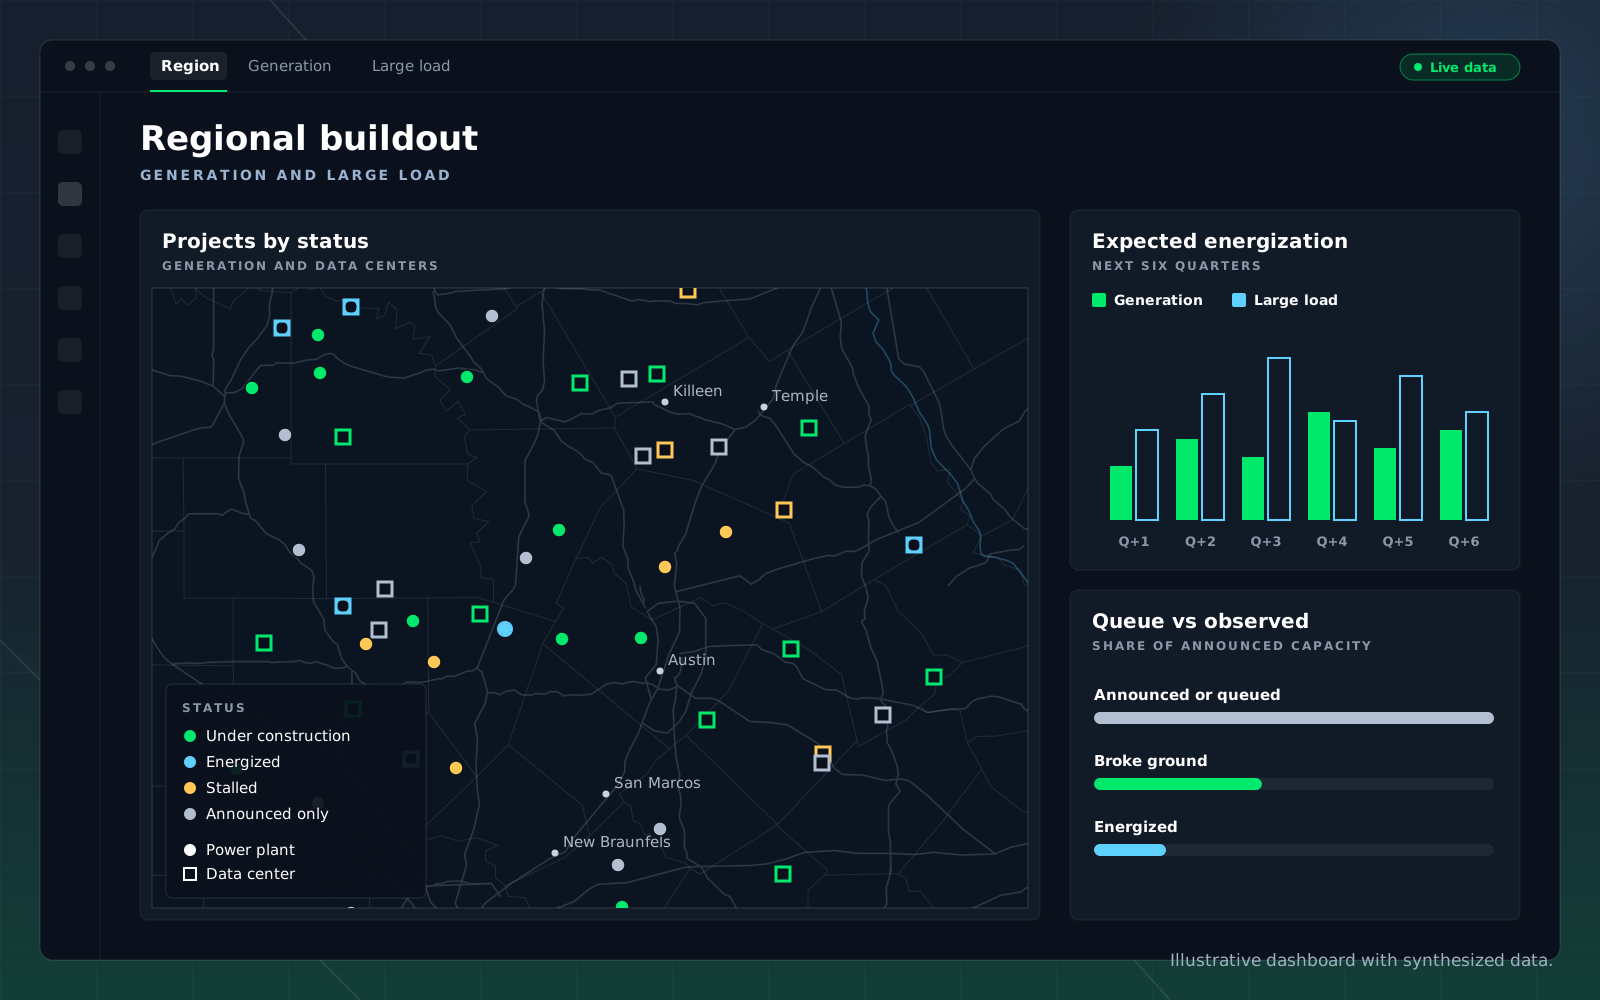
A region’s buildout, in one view.
Generation and large load by status, with expected energization timing.
The map shows every plant and data center in a region by status, beside expected energization by quarter and how much announced capacity has actually broken ground.
Who Uses It
One record, three decisions.
The same buildout record answers different questions depending on the desk asking.
Utilities and grid planners
Data center developers

Power traders
Use Cases
What you can ask it.
Which data center projects have broken ground this year?
Which proposed plants are actually under construction?

When will this site begin drawing full load?

Which interconnection queue entries are real?

How much new load is coming to this region, and when?
Has this facility energized yet?
FAQ
Questions buyers ask.
How do you know a site has energized?
Thermal and activity signatures mark the transition from construction to operating, often ahead of the public record.
Does it cover power plants and data centers?
Yes, on the same basis, so the supply and demand sides of a region come from one record.
How do you treat interconnection queues?
Queues contain far more capacity than will ever be built. Observing each site separates projects under construction from projects that exist only on paper.
Can it tell me when a site will reach full load?
Observed build stage and energization place a site on its ramp, so timing comes from the site rather than the developer schedule.
Can I see new load for a whole region?
Yes. Ask how much new load is coming to a region, and when, and get the projects behind the answer.
How do I get the data?
In the platform, through agents, by API, in Snowflake or in Excel, so the answer arrives in the system your team already uses.
Get Started
Pressure-test your capacity model.
Give us the region you are planning around and we will show you which projects in it are moving, which are not, and when the load is likely to land.