

Solutions
Price the barrel
before the report does.
For gas, power and LNG traders, analysts and marketing desks.
Supply, demand and flows observed as they happen, so your desk positions on the change itself rather than on the consensus that forms after the report.
The Gap
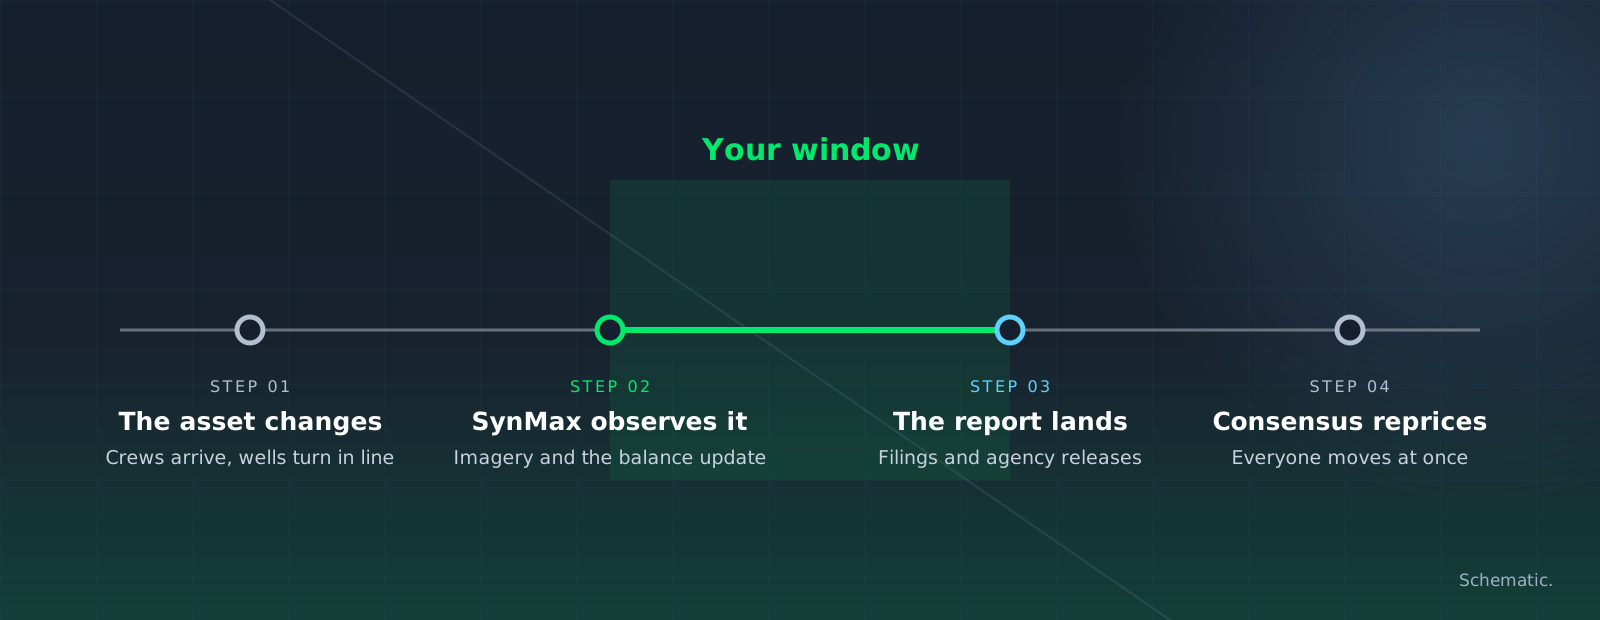
Consensus is the trade everyone already has.
When every desk reads the same release at the same second, the edge is in what you knew before it. Observed field activity is the input that is not yet in the price.

Supply, ahead of the print

LNG pull, daily

Balances that move

Defensible in the room
In Practice
Read the storage week before the print.
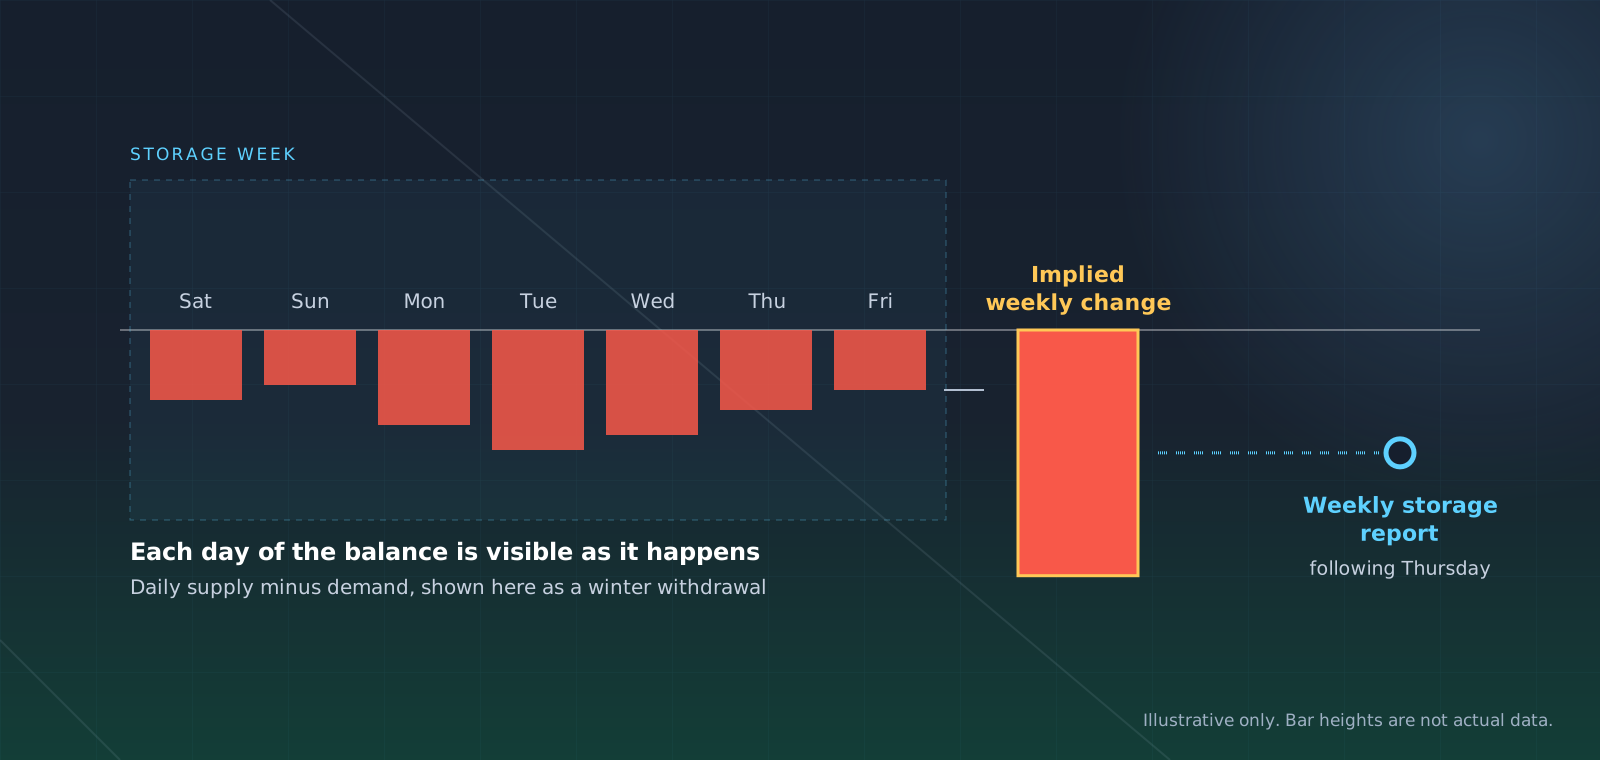
The weekly storage report covers flows through the prior Friday and is published the following Thursday. The Hyperion balance shows supply against demand for each of those days as they happen, so the shape of the week is on your screen while the market waits for the release.
Observed production and daily LNG feedgas by terminal sit underneath the same balance. When the implied number moves, you can see which term moved it.
Scenarios
Price the winter you are worried about.
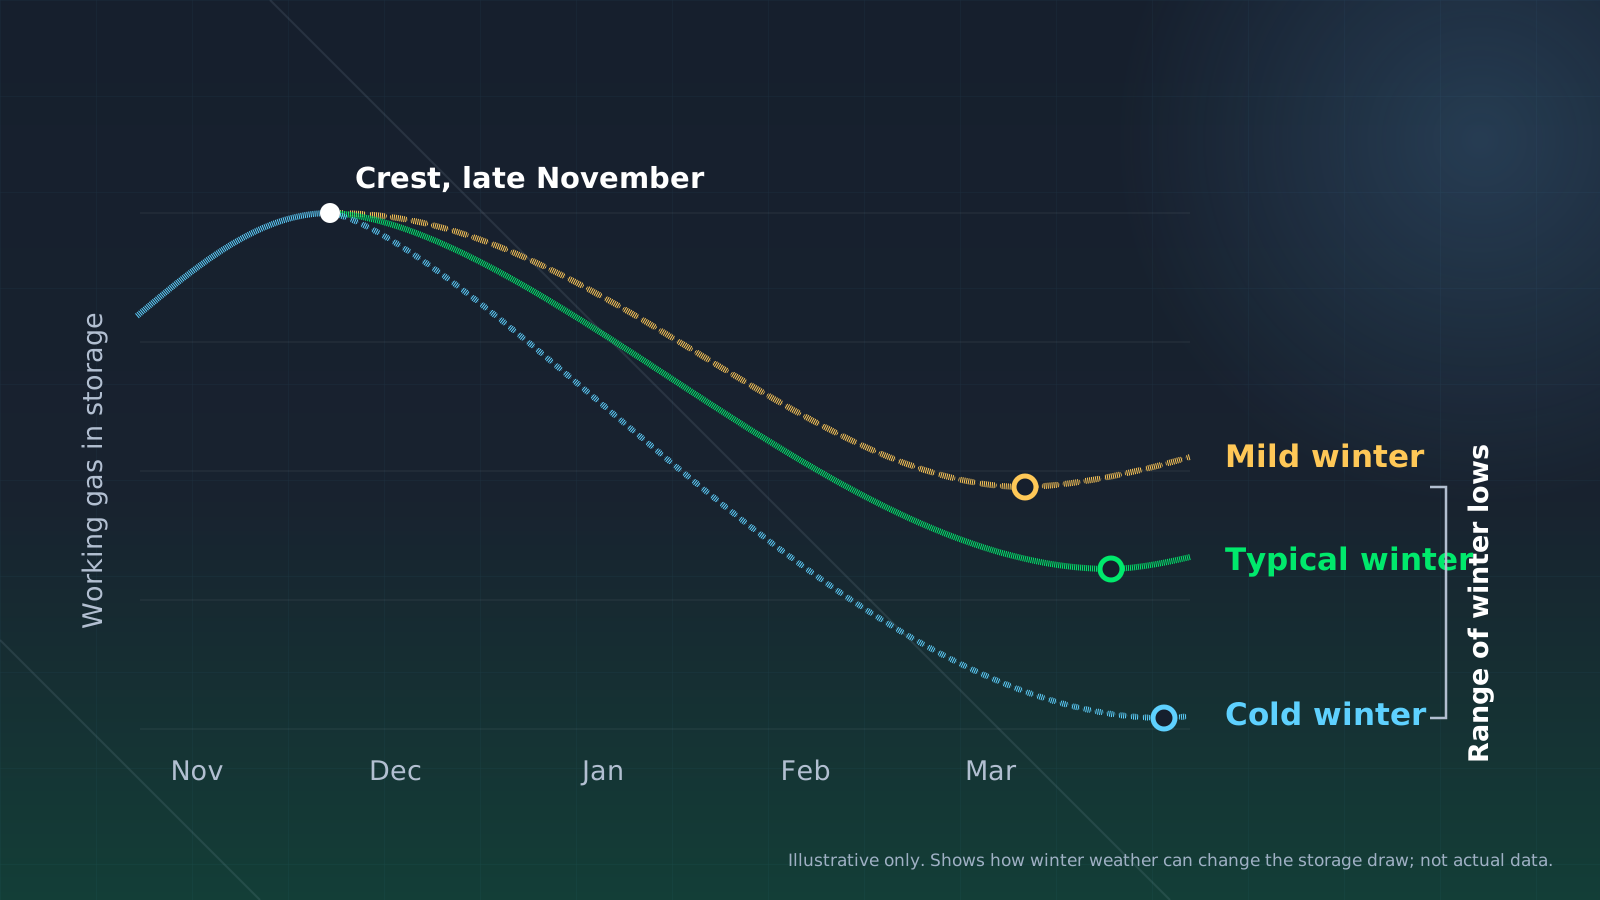
Run the balance under any of the last 25 weather years. Every weather-driven term responds, from residential and commercial demand to LNG feedgas and exports, and storage follows.
Put a mild winter next to a cold one and see how far apart the end-of-season lows land, before the weather decides for you.
On Your Desk
What a gas desk gets.
In the Platform
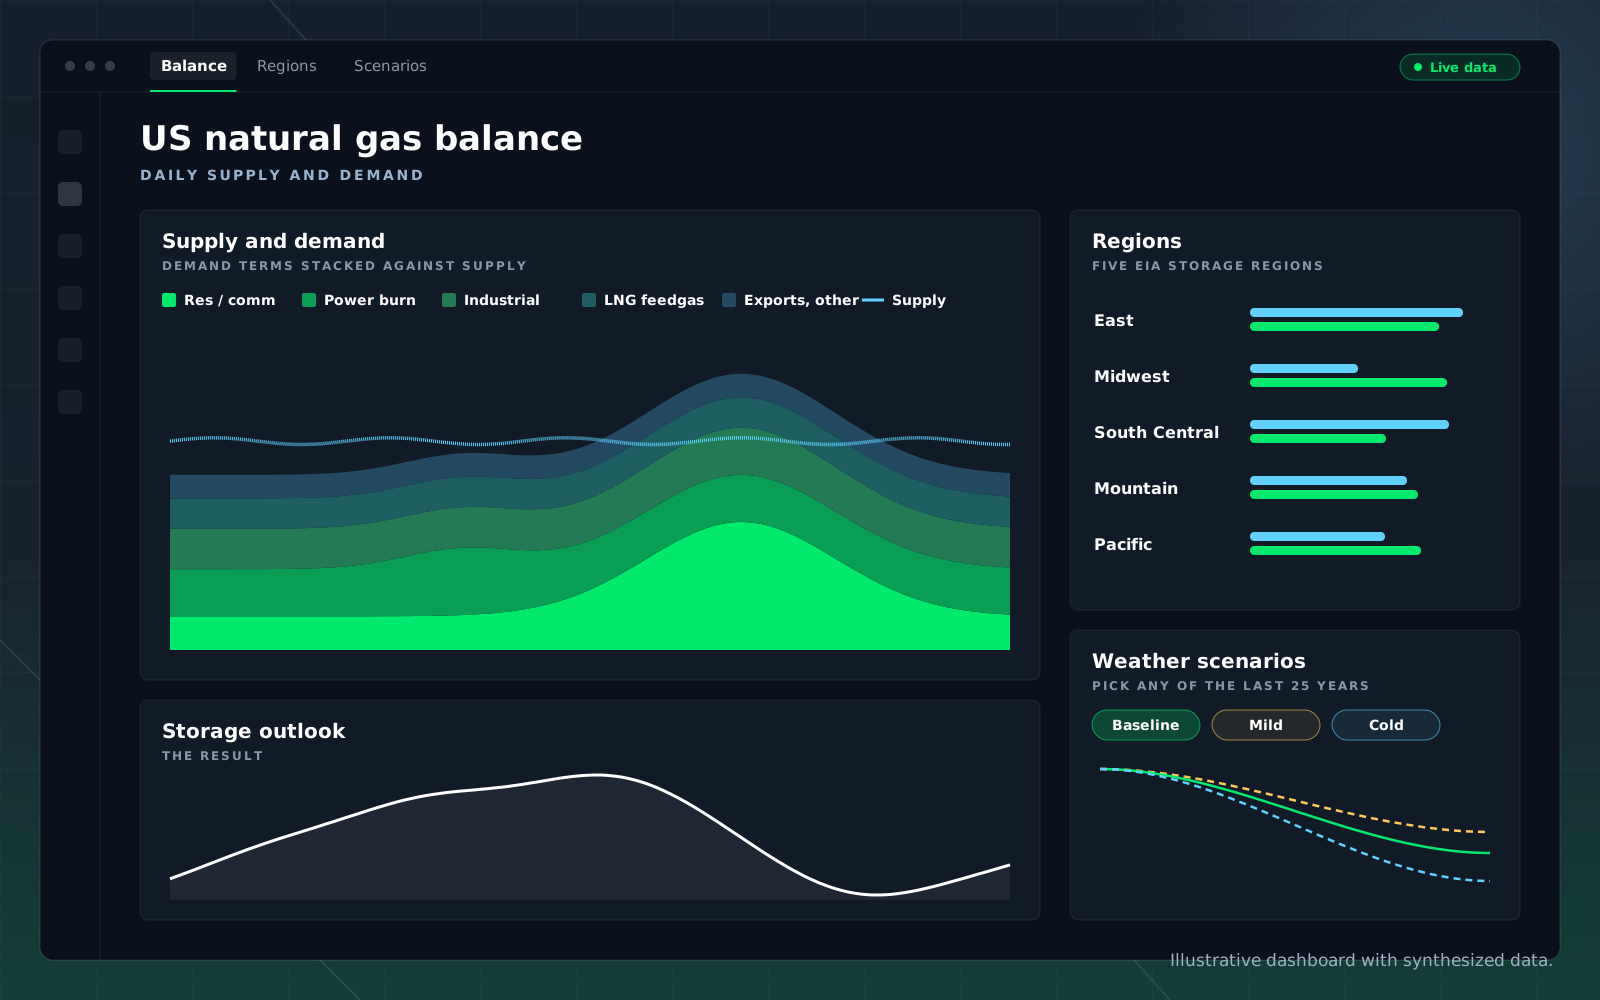
The balance your desk trades.
Daily supply against every demand term, the storage outlook, regional detail and weather scenarios, on one screen.
Use Cases
The questions this desk asks.
Where is production likely to shift before reported data confirms it?

Which basins show a change in completion activity?

Which turn-in-line signals conflict with operator guidance?
How should today’s field activity change our supply forecast?
What is LNG feedgas demand doing this week?

What is building in storage before the release?
Capabilities
What answers them.
Hyperion
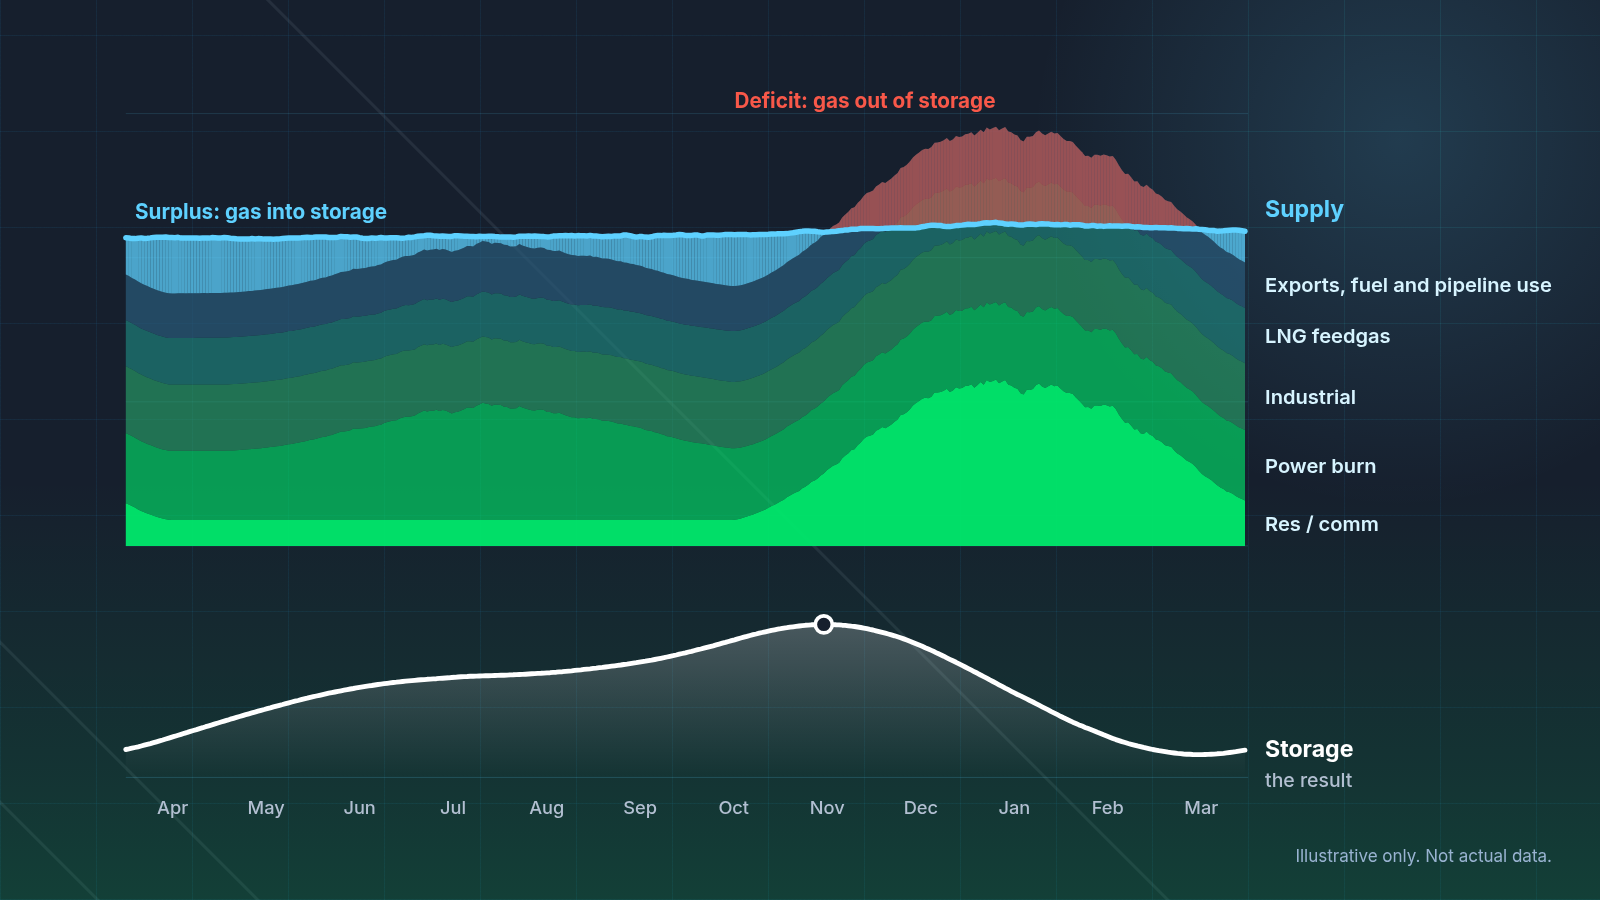
Supply & Demand Balances
US natural gas supply against every demand term, balanced daily and rolled into a storage outlook two years forward.
Hyperion
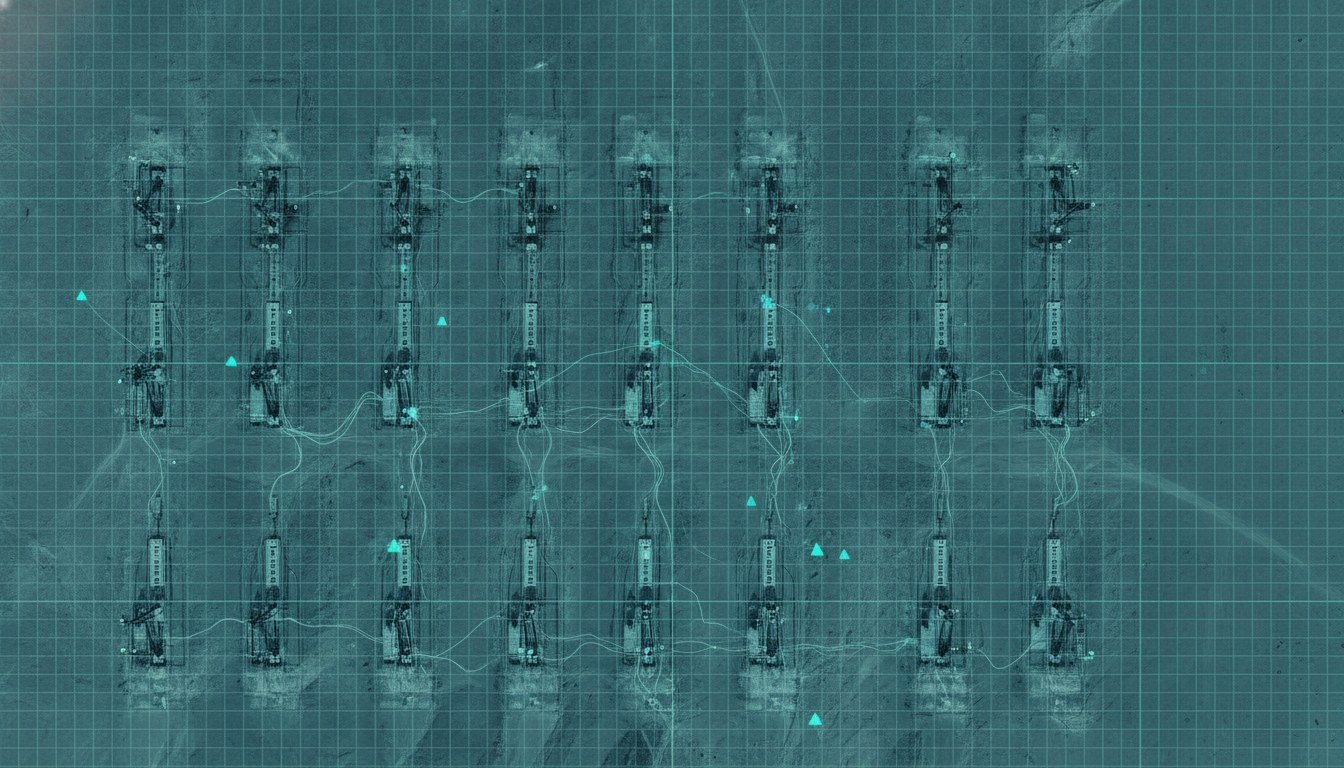
Production Monitoring & Forecasting
Well-level production history and forward forecasts across US oil and gas, with natural gas supply and demand balances that move as field activity does.
Hyperion
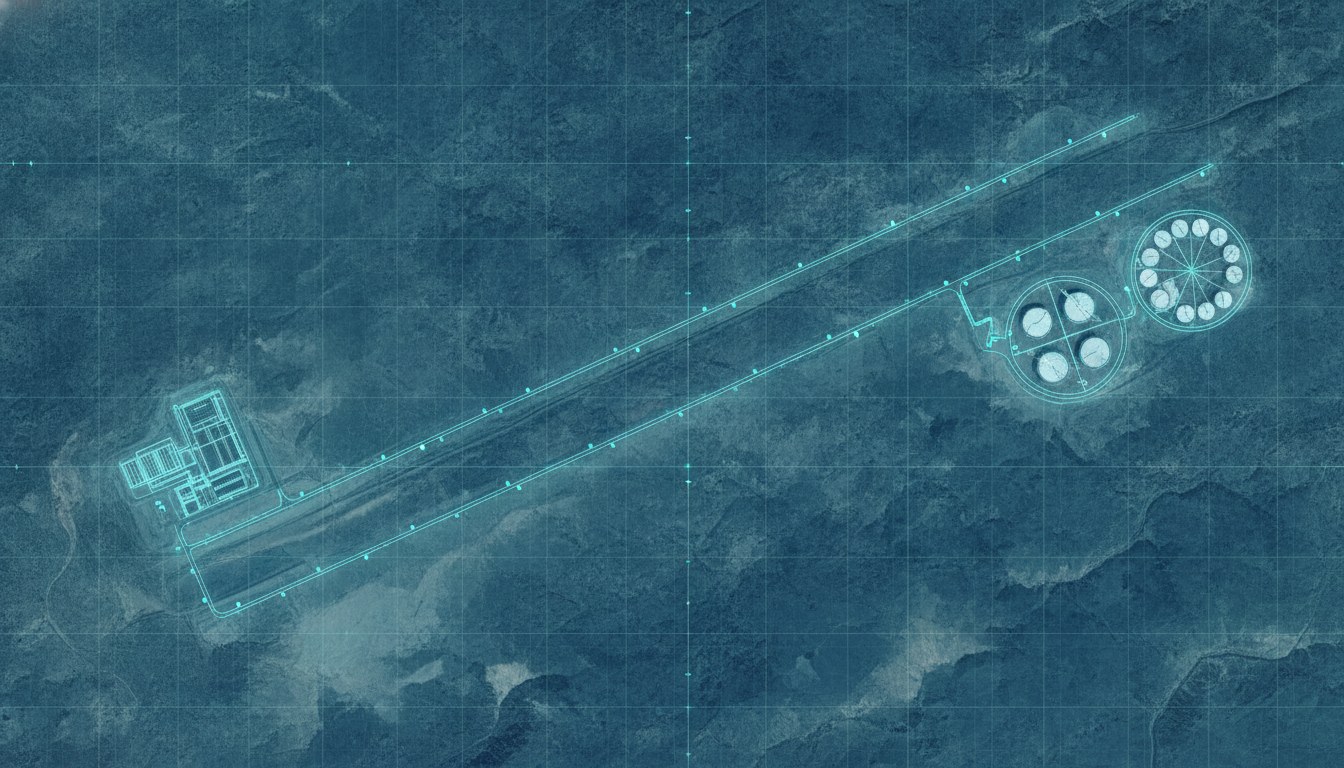
LNG Flows & Cargo Tracking
Daily feedgas demand and cargo movement, followed from the pipeline through to the tanker.
Hyperion · BasinIQ
Storage, Terminals & Inventory
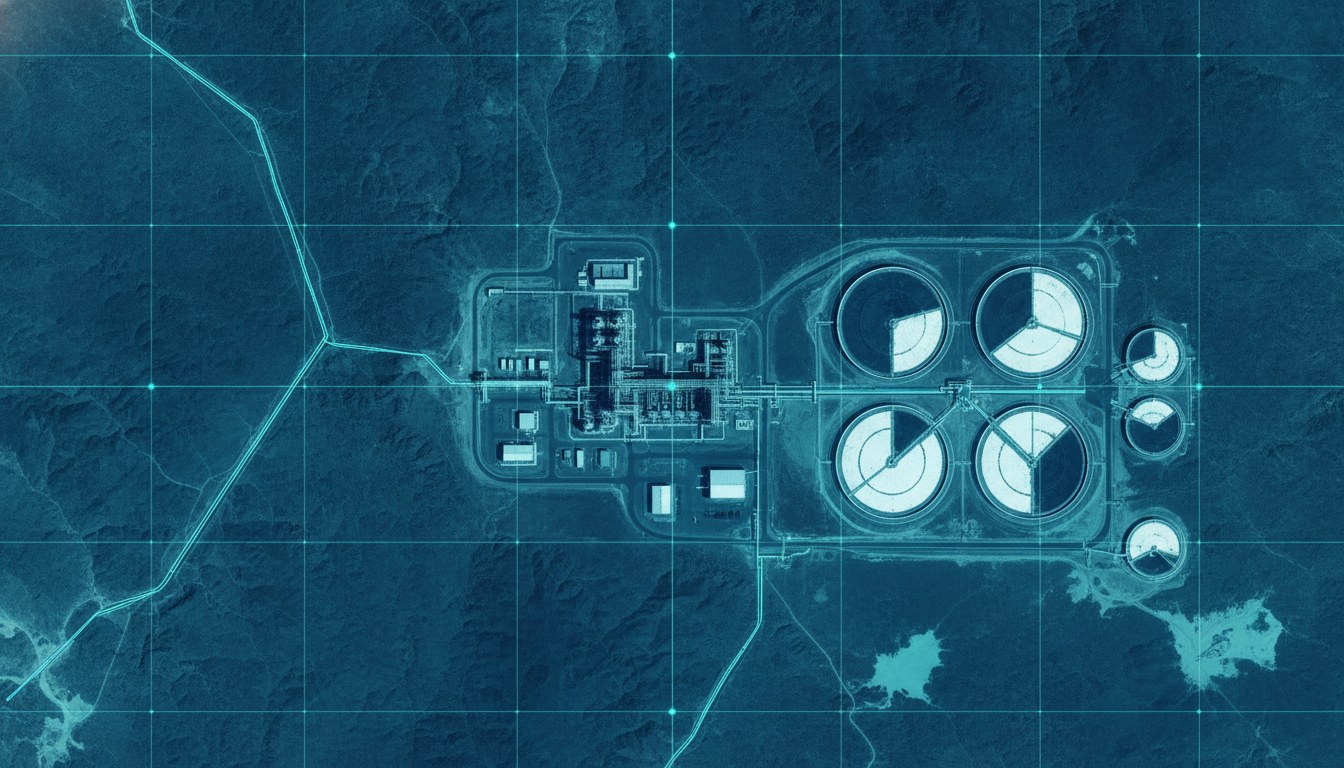
Tank and terminal activity read from imagery, for an inventory picture that does not wait on the next report.
FAQ
Questions buyers ask.
How often does the data update?
The supply and demand balance updates daily with intraday refreshes. LNG feedgas is daily by terminal. Production updates as new activity is observed.
Can I pull it into my own models?
Yes. The API and data tables carry full history and forecasts, with LNG feedgas by terminal in its own table.
How is the demand baseline built?
Each of the last ten weather years runs through the demand models, and the ten outcomes are averaged. That keeps winter and summer peaks in the baseline instead of smoothing them away.
Is this oil or gas?
Both. Production monitoring covers US oil and gas. The supply and demand balance, storage outlook and LNG feedgas are natural gas.
Where does the data come from?
Satellite imagery and other sensing of the physical assets, combined with public filings and market inputs such as weather and the forward gas curve, and reconciled as reported data lands.
What does a demo look like?
Bring a basin, a terminal or a storage week you are watching. Our natural gas analysts will walk through it in the balance with you.
Get Started
Put an observed number behind your next position.
Tell us the market you trade and we will show you the observed supply signal next to the consensus view.