

Solutions
Know which generation
is actually being built.
For utilities, IPPs, grid planners and power traders.
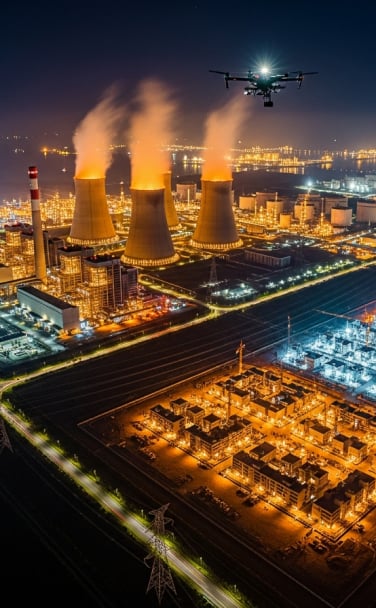
Every announced, queued and permitted project is checked against the site, so your capacity model splits real generation from speculative capacity before an in-service date slips.
The Gap
The queue is not the grid.
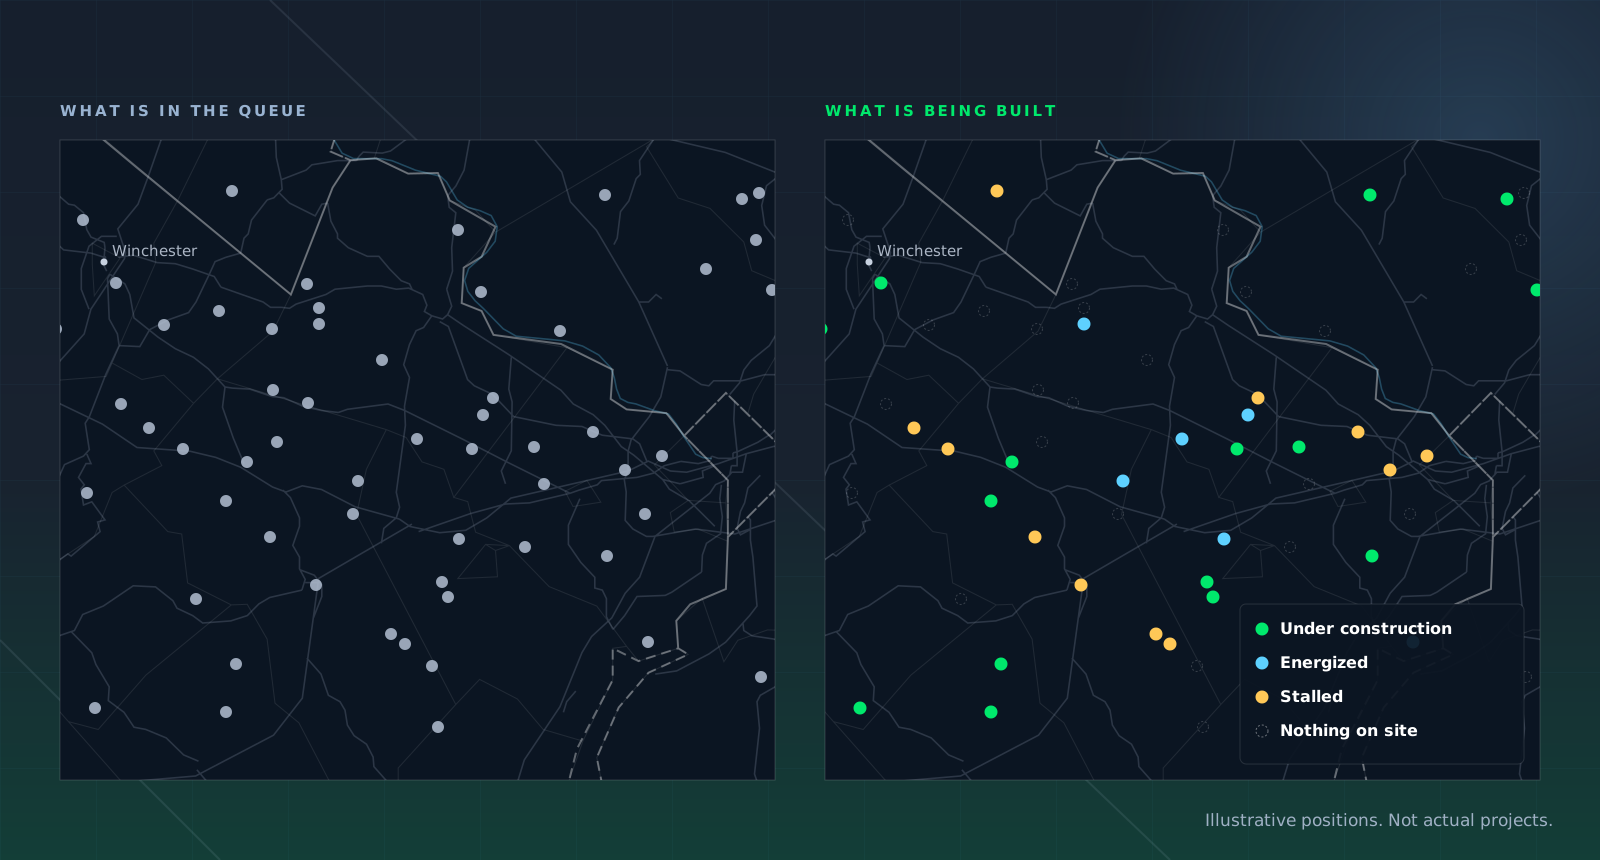
Interconnection queues and announced pipelines overstate what will come online, and the gap between plan and reality decides reserve margins and price.

Generation, verified

Delays, early

Operating status

Load on the same basis
In Practice
Build the capacity model from the ground.
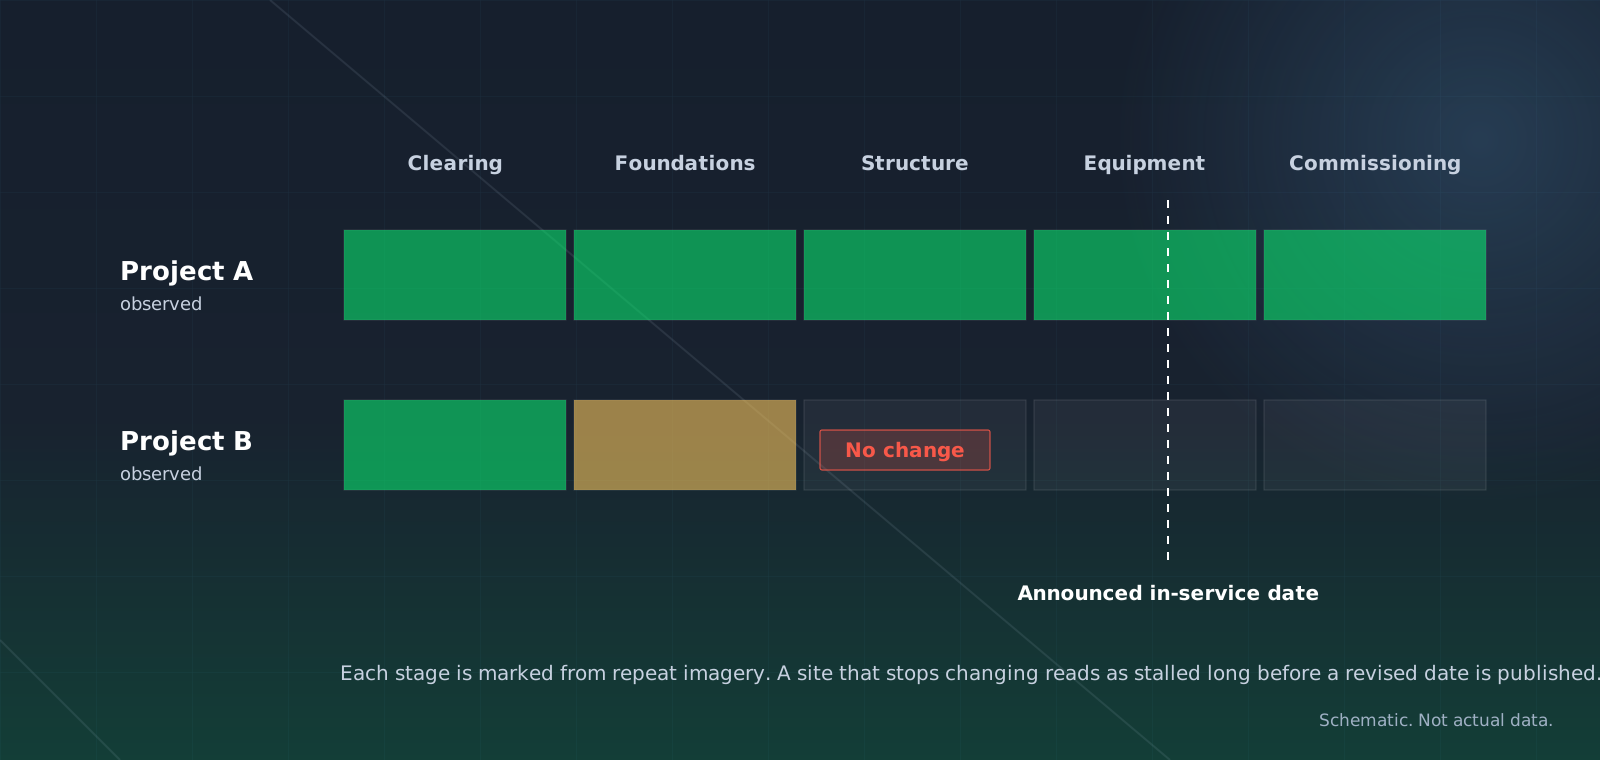
Start with every project in your region. Observation splits it into projects under construction, projects that started and stalled, and projects with nothing on site. Each real project gets a completion estimate that updates as the site does.
Existing units are watched too. Thermal and activity signal show whether a unit is running, in outage, or retired in all but name.
Load on Its Own Curve
Plan for load as it really arrives.
New large-load sites are tracked alongside generation, so both sides of the balance come from one record.
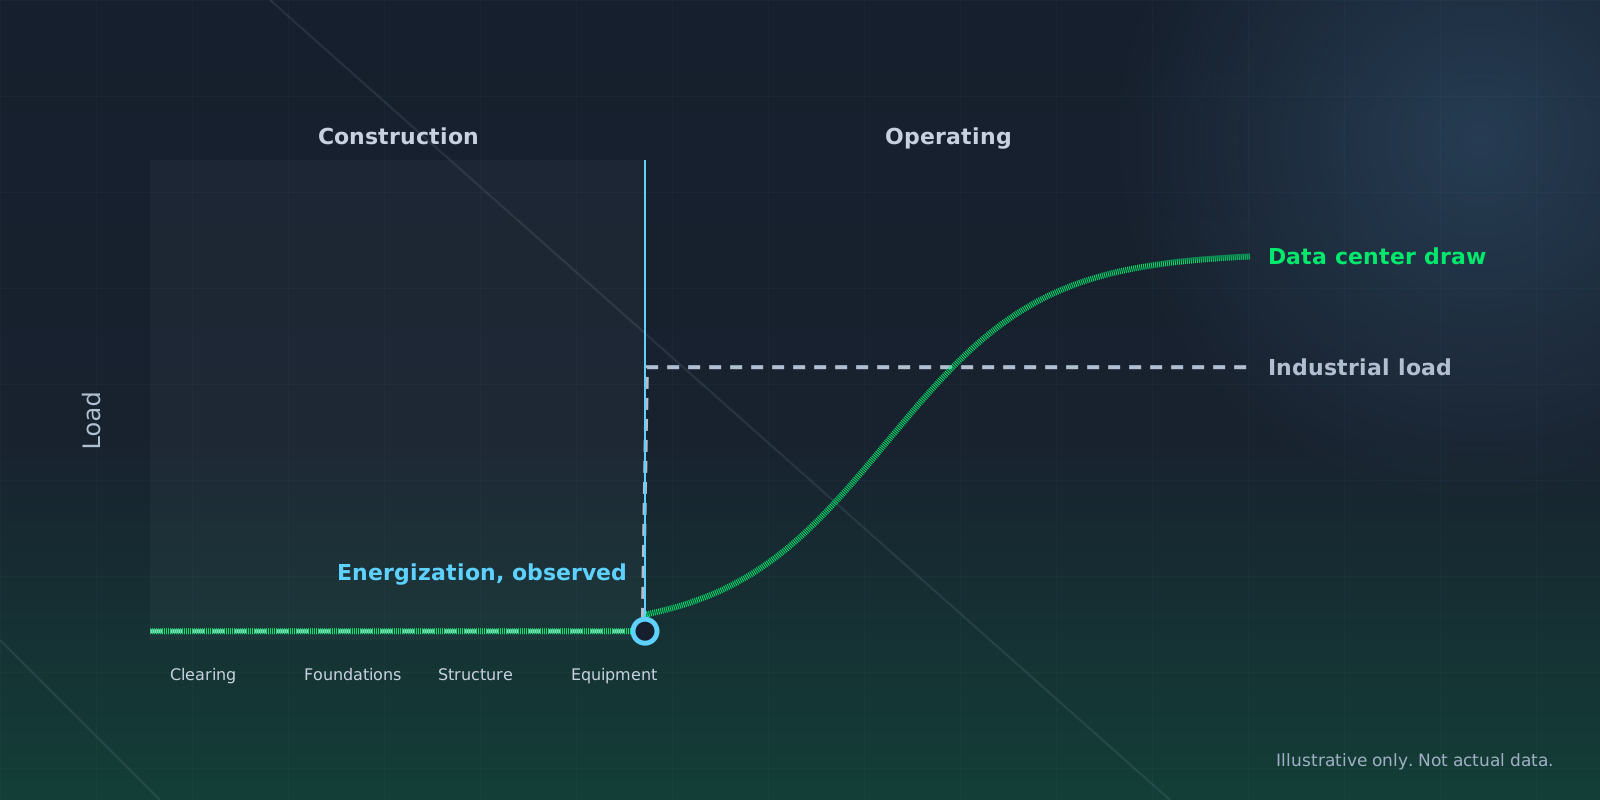
A data center ramps to full draw on its own curve after it energizes, and its build stage says where it sits on that curve. That is what a reserve margin actually depends on.
On Your Desk
What a power desk gets.
In the Platform
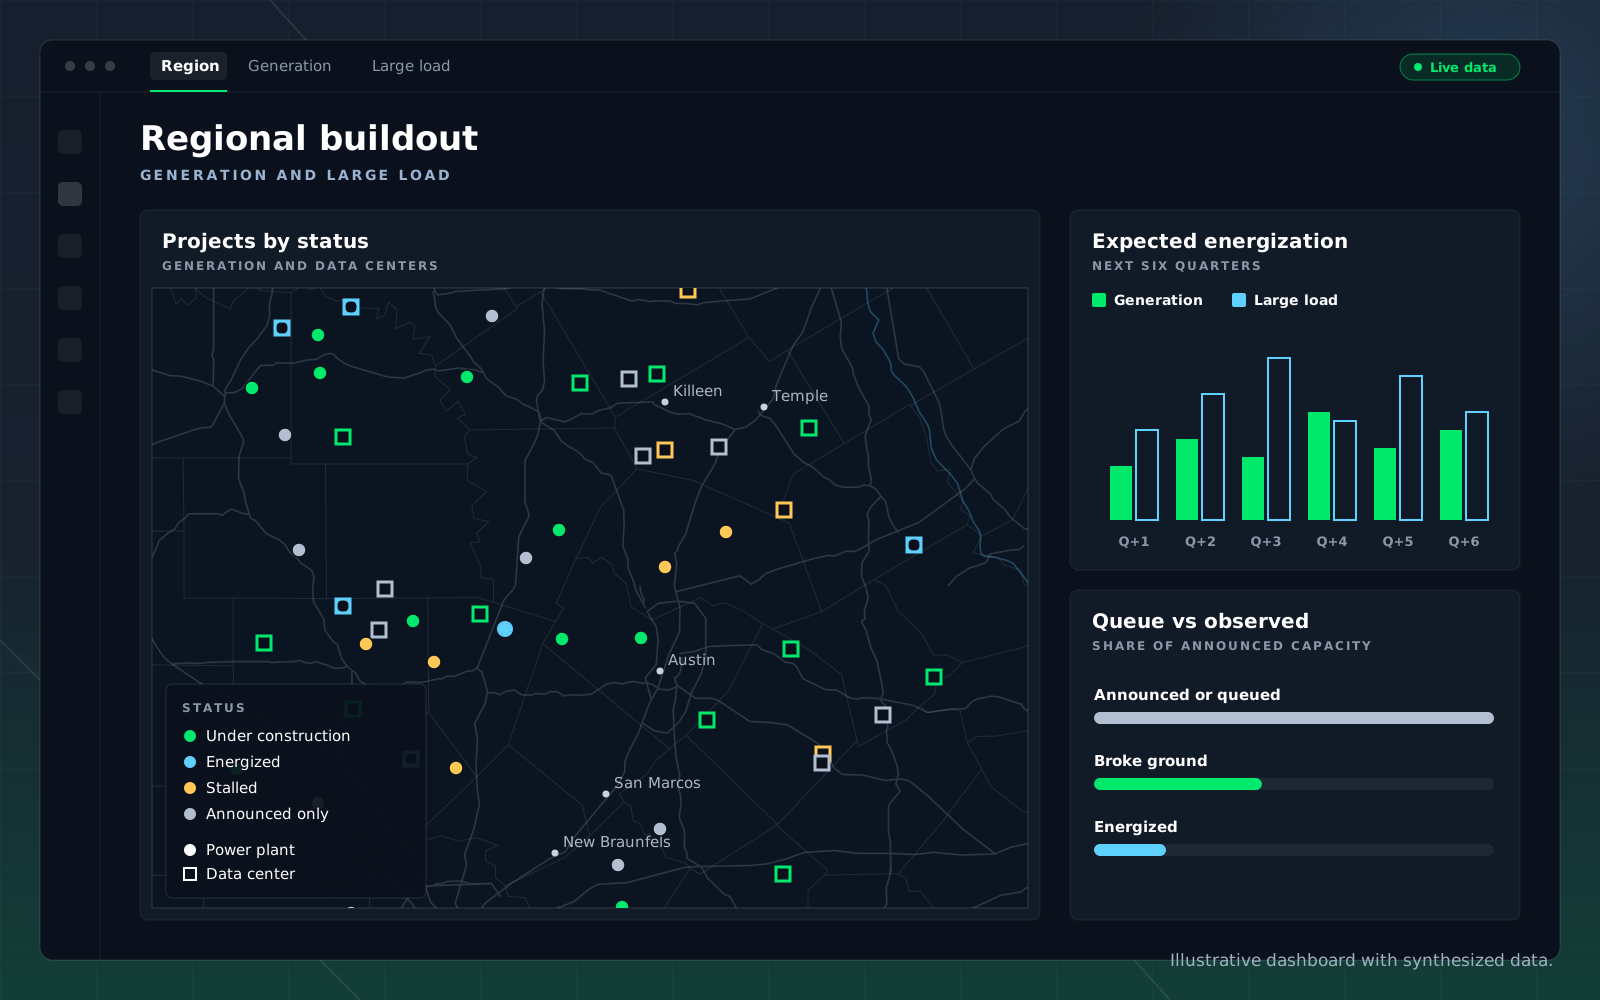
Your region’s buildout.
Generation and large load by status across your service territory, with expected energization timing.
Use Cases
The questions this desk asks.
Which proposed power plants have actually broken ground?
Which projects appear stalled or delayed?
What changed at this facility after the weather event?

Which projects belong in our capacity model?

Is this unit running, or effectively offline?

How much new generation is landing in this region next year?
Capabilities
What answers them.
Hyperion
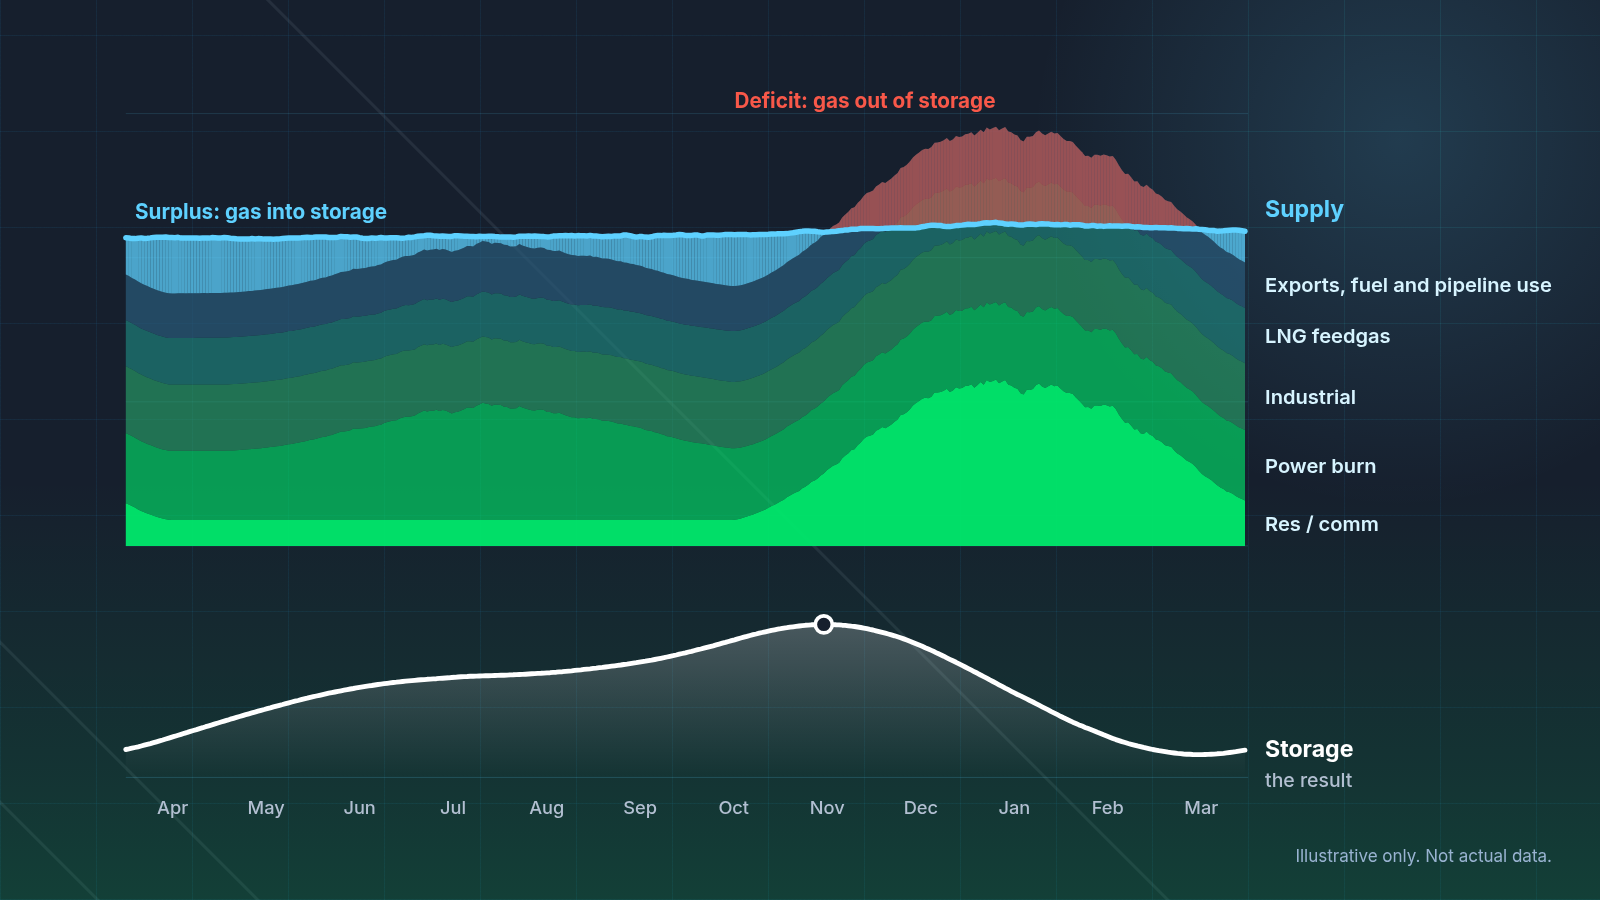
Supply & Demand Balances
US natural gas supply against every demand term, balanced daily and rolled into a storage outlook two years forward.
Vulcan
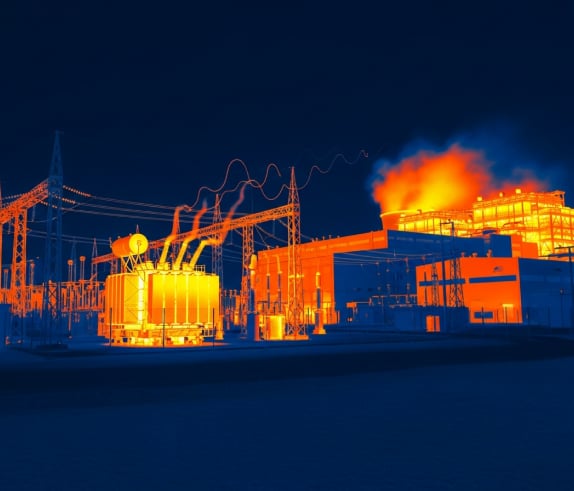
Power & Datacenter Buildout
Power plants and data centers tracked through construction, so capacity models rest on what is built rather than what was announced.

Vulcan
Construction & Project Completion
Which announced projects have broken ground, which have stalled, and when each is likely to come online.
Hyperion
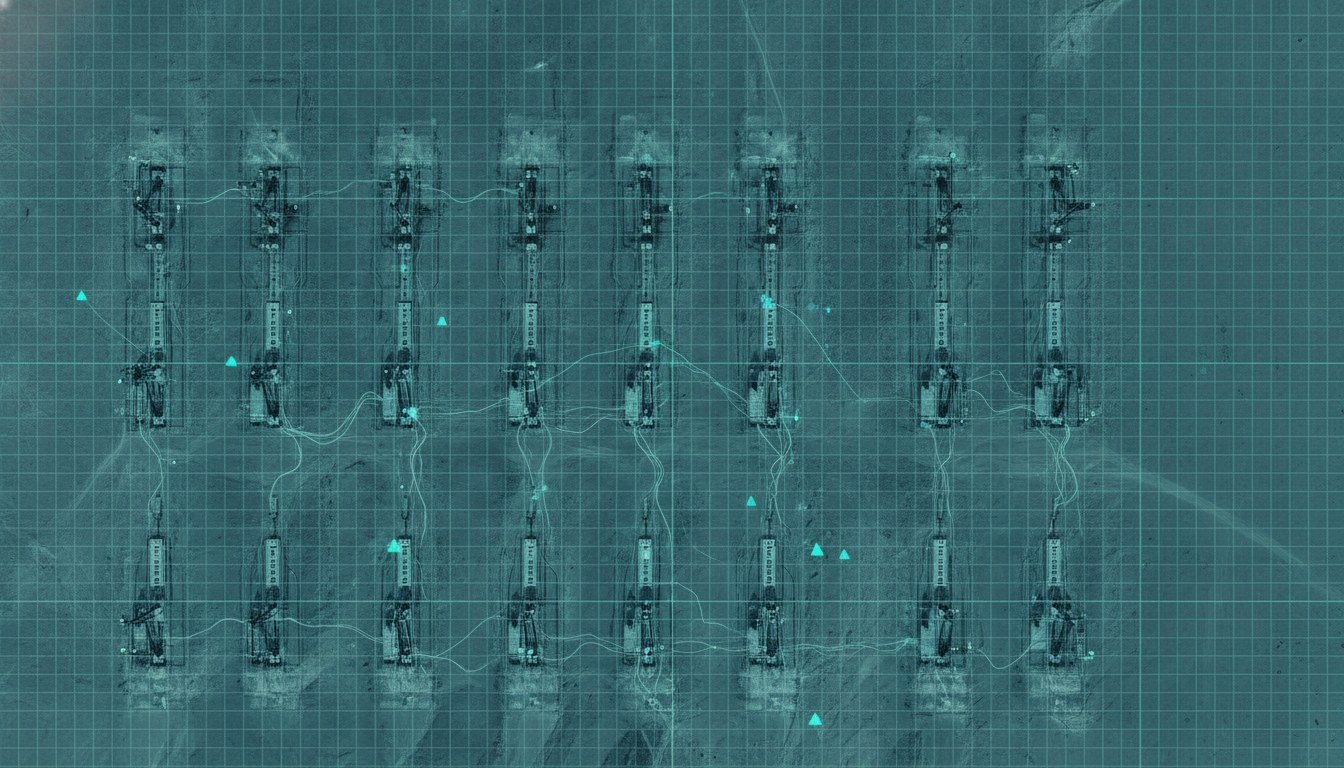
Production Monitoring & Forecasting
Well-level production history and forward forecasts across US oil and gas, with natural gas supply and demand balances that move as field activity does.
FAQ
Questions buyers ask.
Which projects are covered?
Announced, queued and permitted generation, along with large-load sites, tracked through construction and into operation.
How do you separate real projects from speculative ones?
Each project is observed on site. A permit and a queue position do not move dirt, and the site shows whether anything has started.
Can you tell if an existing unit is running?
Yes. Thermal and activity signal show whether a unit is running, in outage, or effectively offline.
Can I check a facility after a weather event?
Yes. Repeat imagery shows what changed at a facility after the event.
Is there a gas view for power burn?
Yes. Power burn is one of the demand terms in the Hyperion supply and demand balance, modeled on weather, the forward gas curve, load growth and renewables.
How do I get the data?
In the platform, through agents, by API, in Snowflake or in Excel, so the answer arrives in the system your team already uses.
Get Started
Check your capacity assumptions against the ground.
Give us the service territory or the region you plan for and we will show you which projects in it are real and on schedule.