

Solutions
Site load where
the power will actually be.
For developers, hyperscaler infrastructure teams and site selectors.
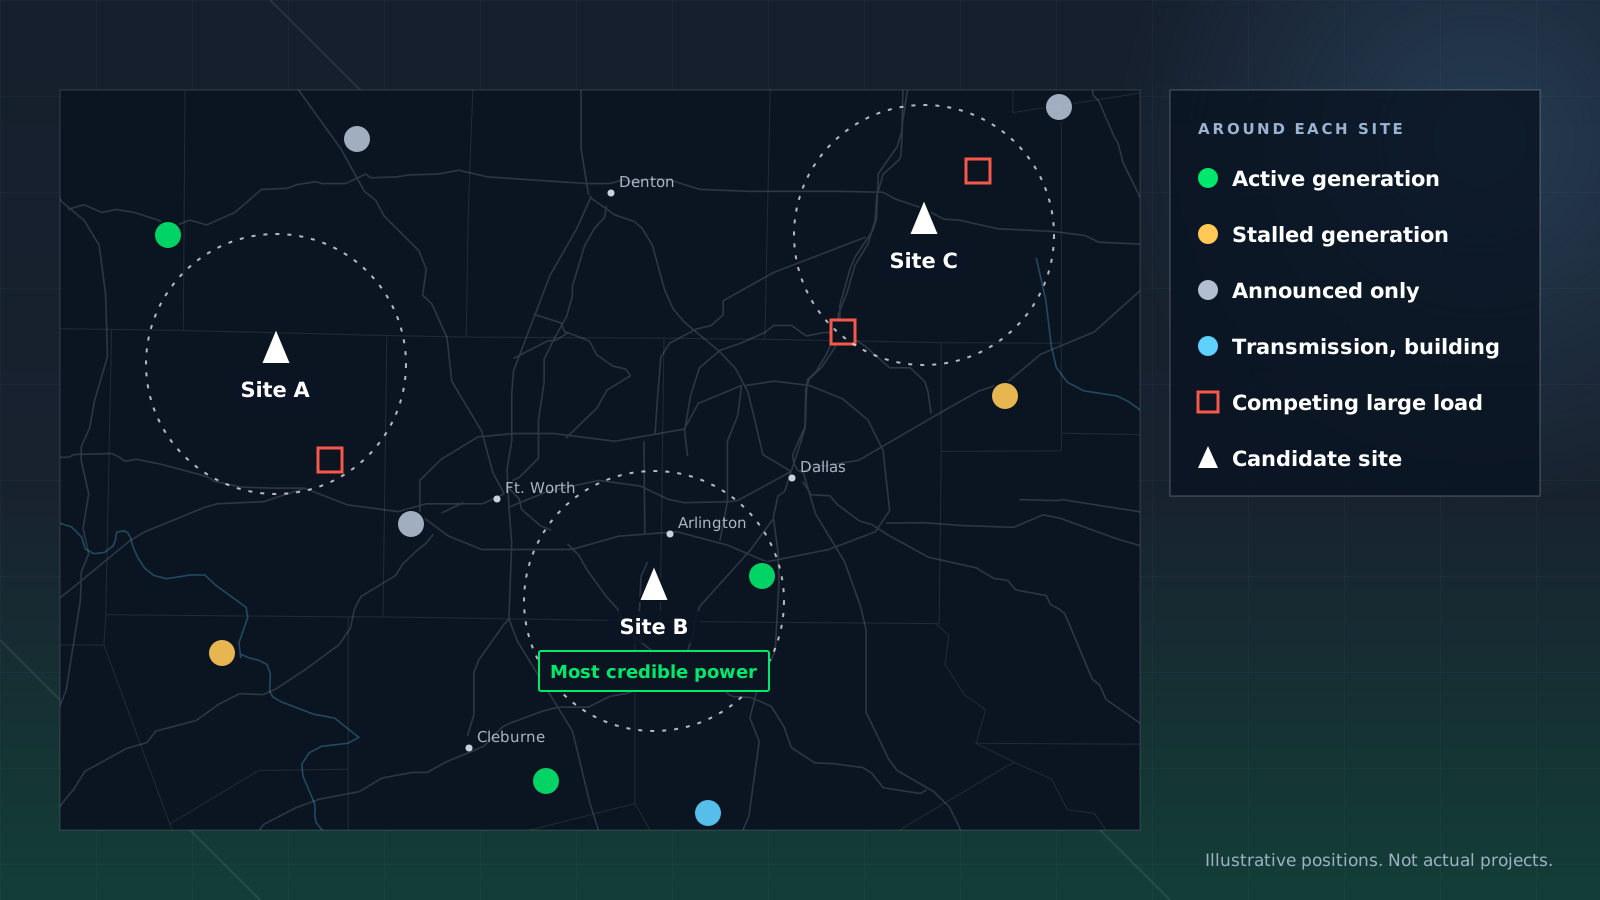
Generation, transmission and competing load around each candidate site are tracked through construction, so a site is chosen on power that will exist when it energizes.
The Gap
A site is only as good as the power behind it.
The constraint on new data center capacity is increasingly power, not land. Picking a site on announced generation is picking it on someone else’s optimism.

Supply you can count on

Competing load, visible

Timing that holds

Site-level detail
In Practice
Discount the announcements.
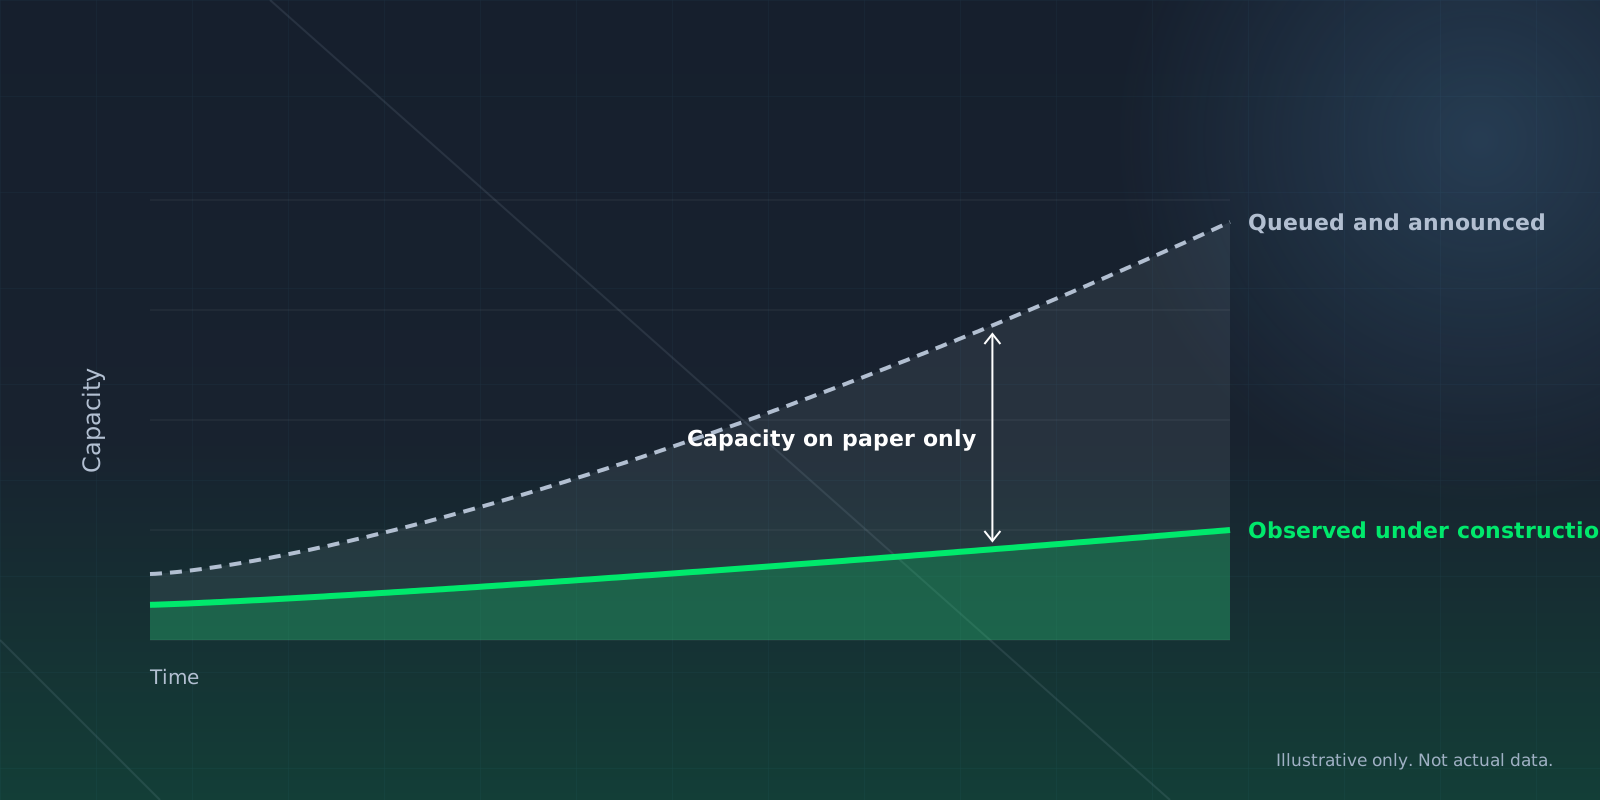
Announced generation and interconnection queues both overstate what will exist. Observing each project separates the plants being built from the ones that exist only on paper, so a site is scored on power that will be there.
Competing large-load projects are observed on the same basis, so you also see who else is drawing on the same system, and when.
Timing That Holds
Energize when the power does.
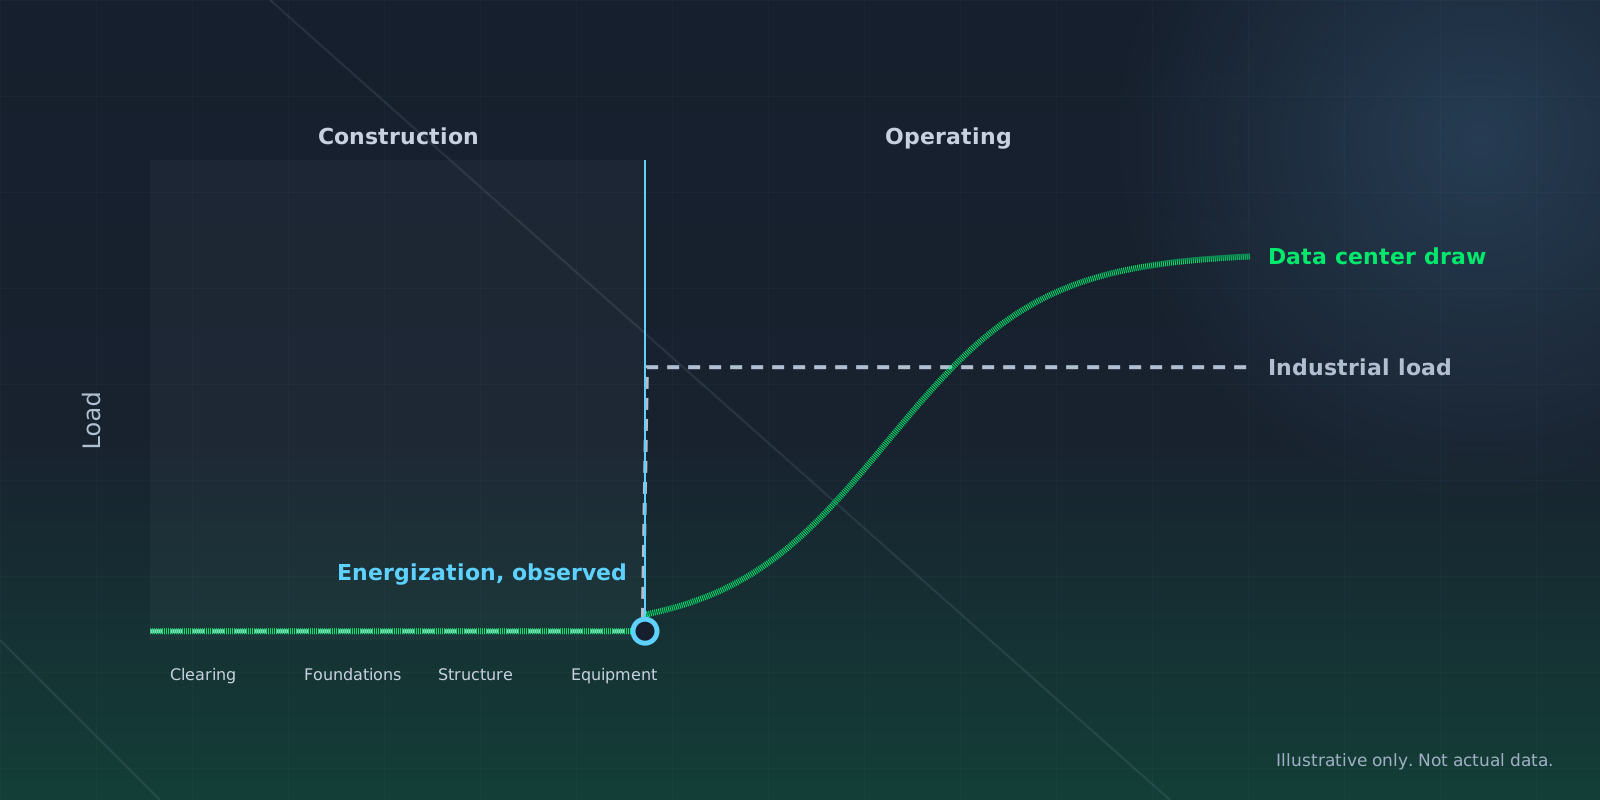
Energization estimates come from observed build stage at each site, not from developer schedules, for competing projects and for the plants that will serve you.
That turns a siting decision from a bet on someone else’s timeline into a comparison of evidence.
On Your Desk
What a siting team gets.
In the Platform
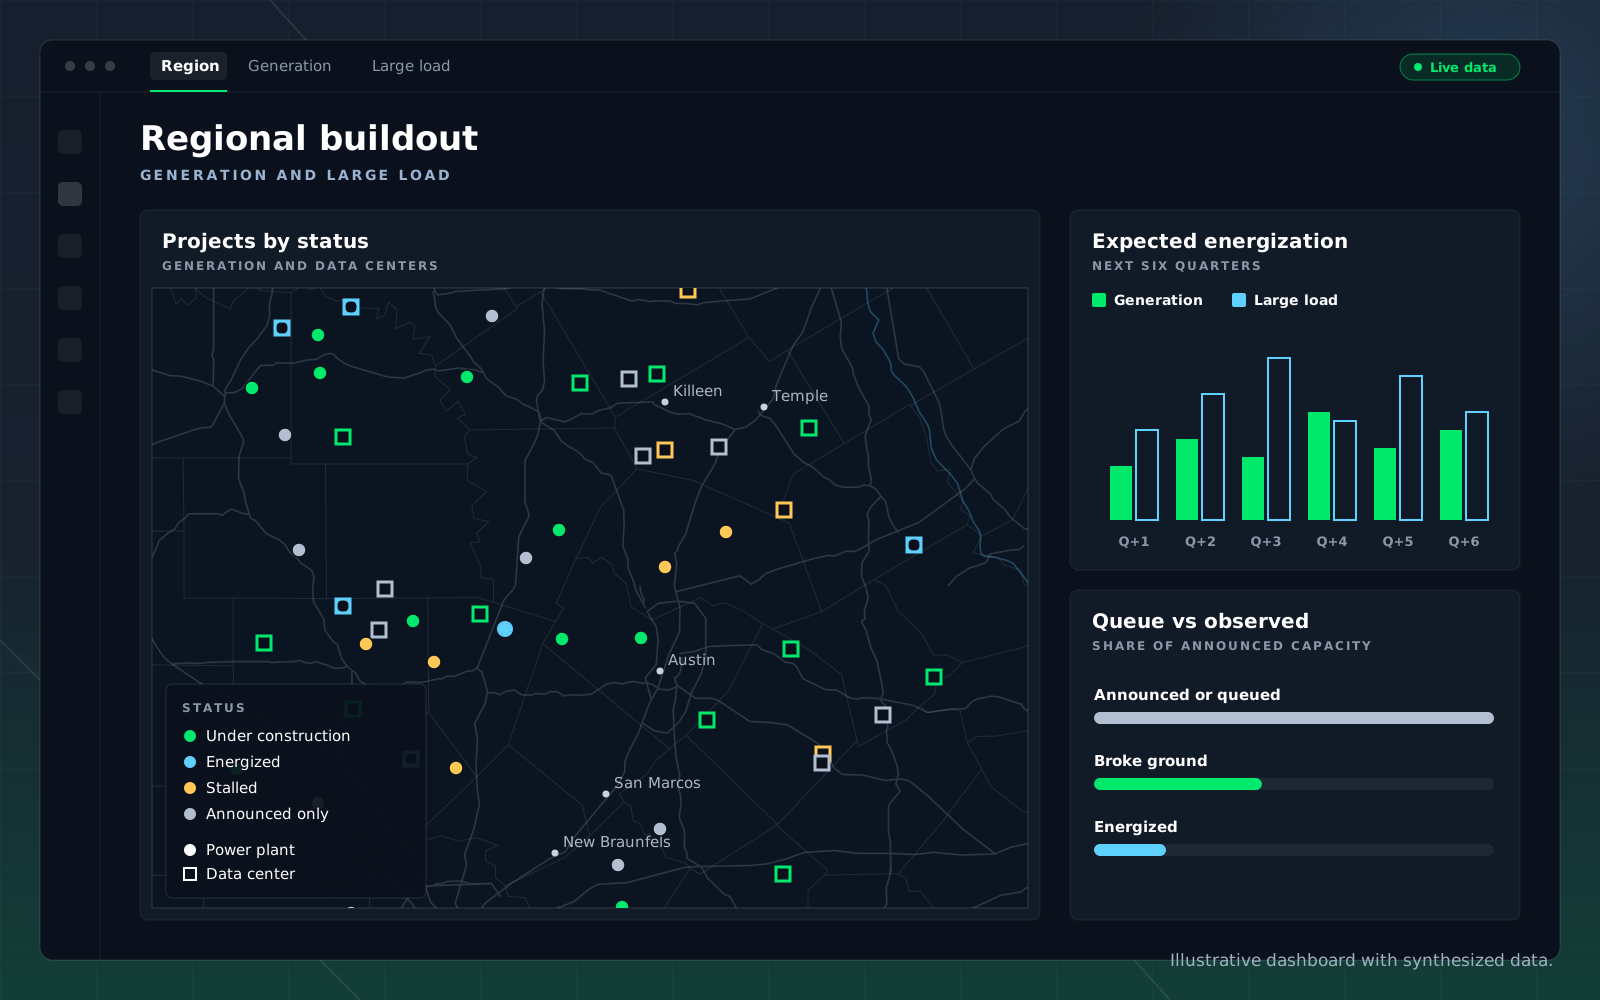
The power picture around your sites.
Generation and large load by status around the regions you are weighing, with expected energization timing.
Use Cases
The questions this desk asks.
Which data center projects in this region have broken ground?
What generation will serve this site, and is it being built?
When will competing large-load projects energize?
Which candidate sites have the most credible power supply?

How much new load is this region absorbing, and how fast?

Which announced projects should we discount?
Capabilities
What answers them.
Vulcan
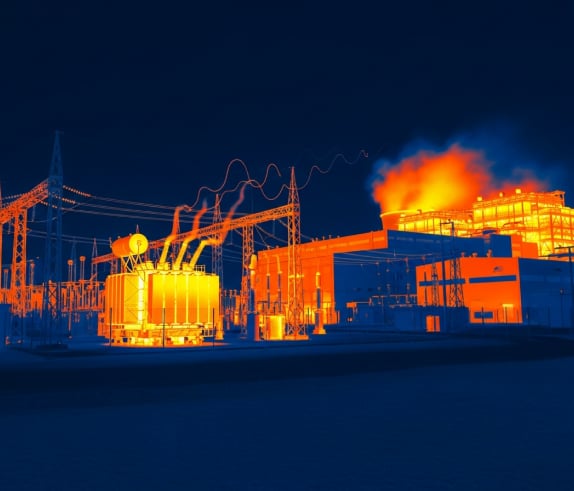
Power & Datacenter Buildout
Power plants and data centers tracked through construction, so capacity models rest on what is built rather than what was announced.

Vulcan
Construction & Project Completion
Which announced projects have broken ground, which have stalled, and when each is likely to come online.
Hyperion
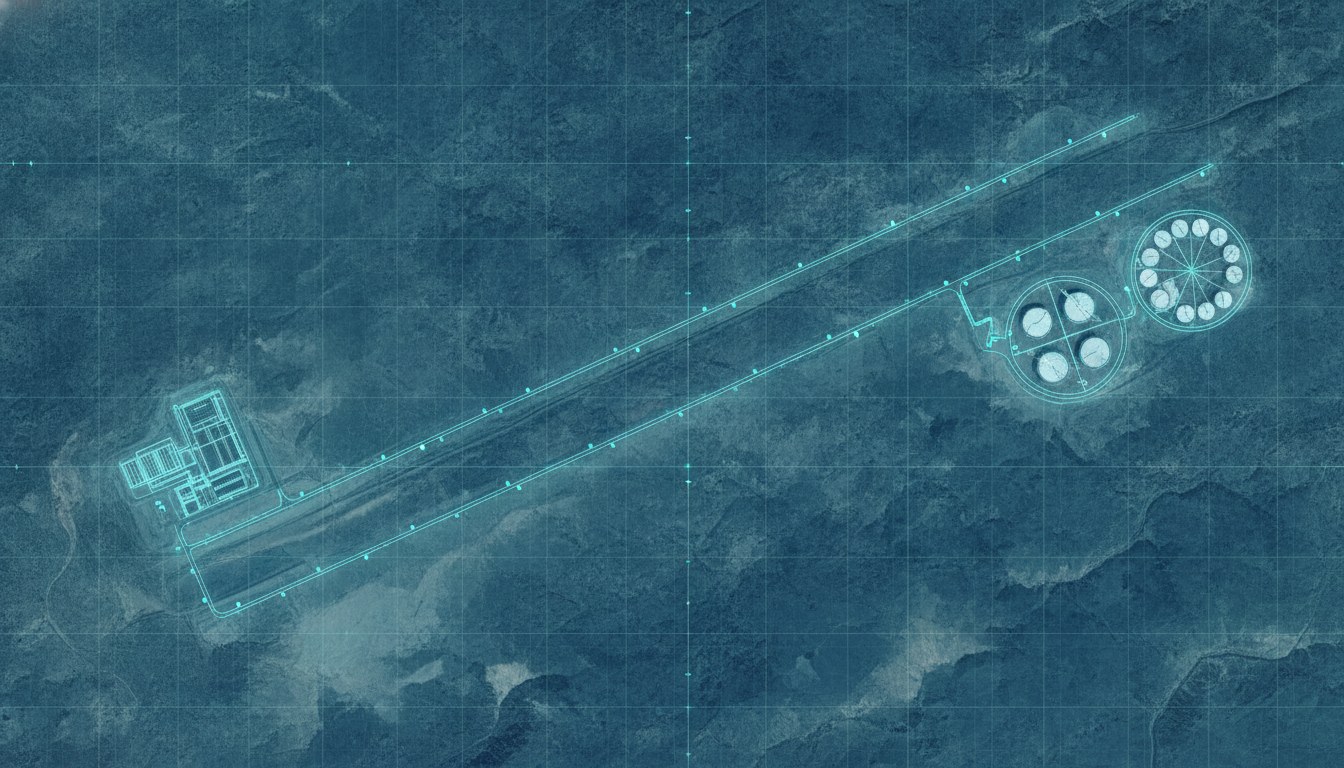
LNG Flows & Cargo Tracking
Daily feedgas demand and cargo movement, followed from the pipeline through to the tanker.
FAQ
Questions buyers ask.
How do you judge whether a site has credible power?
By the generation actually being built to serve it. Each plant is tracked through construction, so the power story behind a site can be verified rather than assumed.
Can I see competing data center projects?
Yes. Other large-load projects are observed on the same basis, including when they are likely to energize.
Where do the energization dates come from?
From observed build stage at each site, not from developer schedules.
Is the analysis site-specific?
Yes. Projects are tracked at coordinates, so the answer is about your parcel, not a regional average.
Which announced projects should we discount?
Those with no observed activity on site. Observation separates queued and announced capacity from capacity that is being built.
How do I get the data?
In the platform, through agents, by API, in Snowflake or in Excel, so the answer arrives in the system your team already uses.
Get Started
Bring the sites on your shortlist.
Share the regions or parcels you are weighing and we will show you the observed power and load picture around each.