

Solutions
Flow, feedgas and cargo
on one record.
For pipeline, terminal and LNG export operators and their commercial teams.
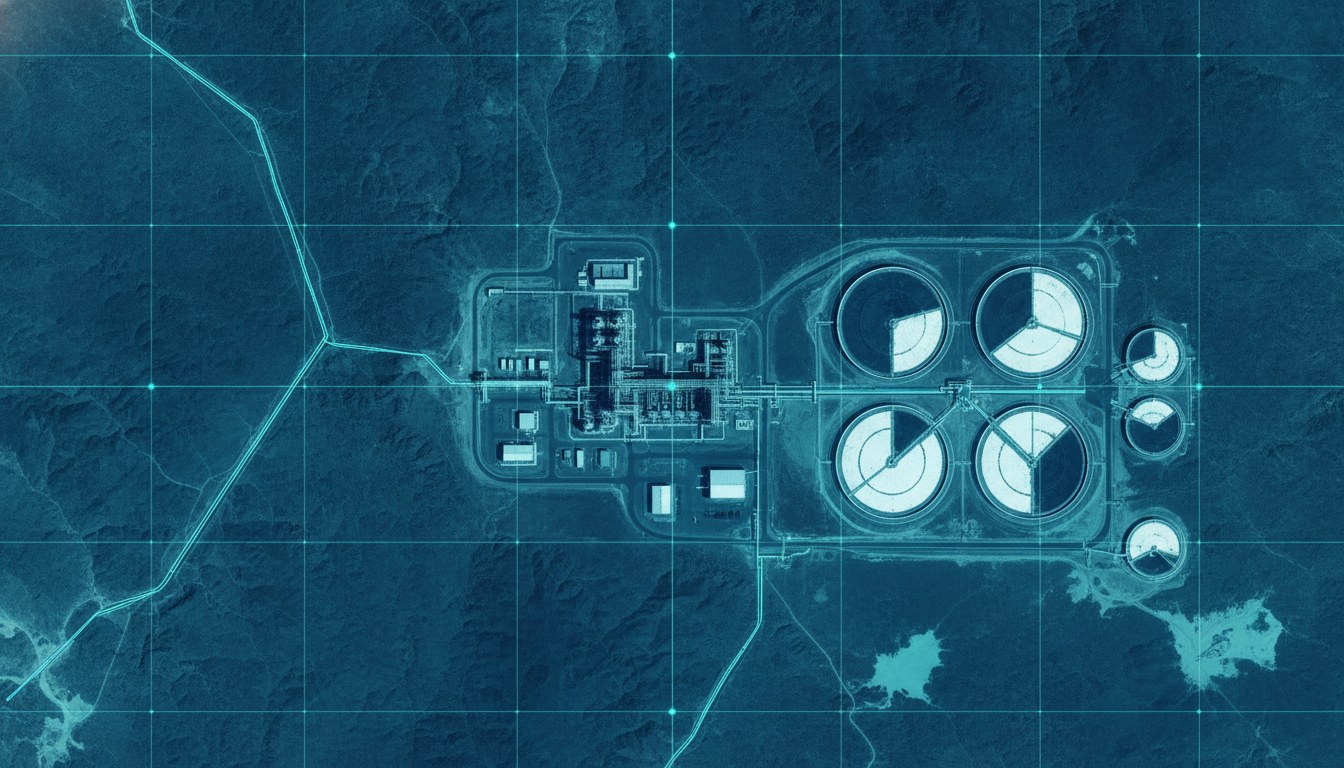
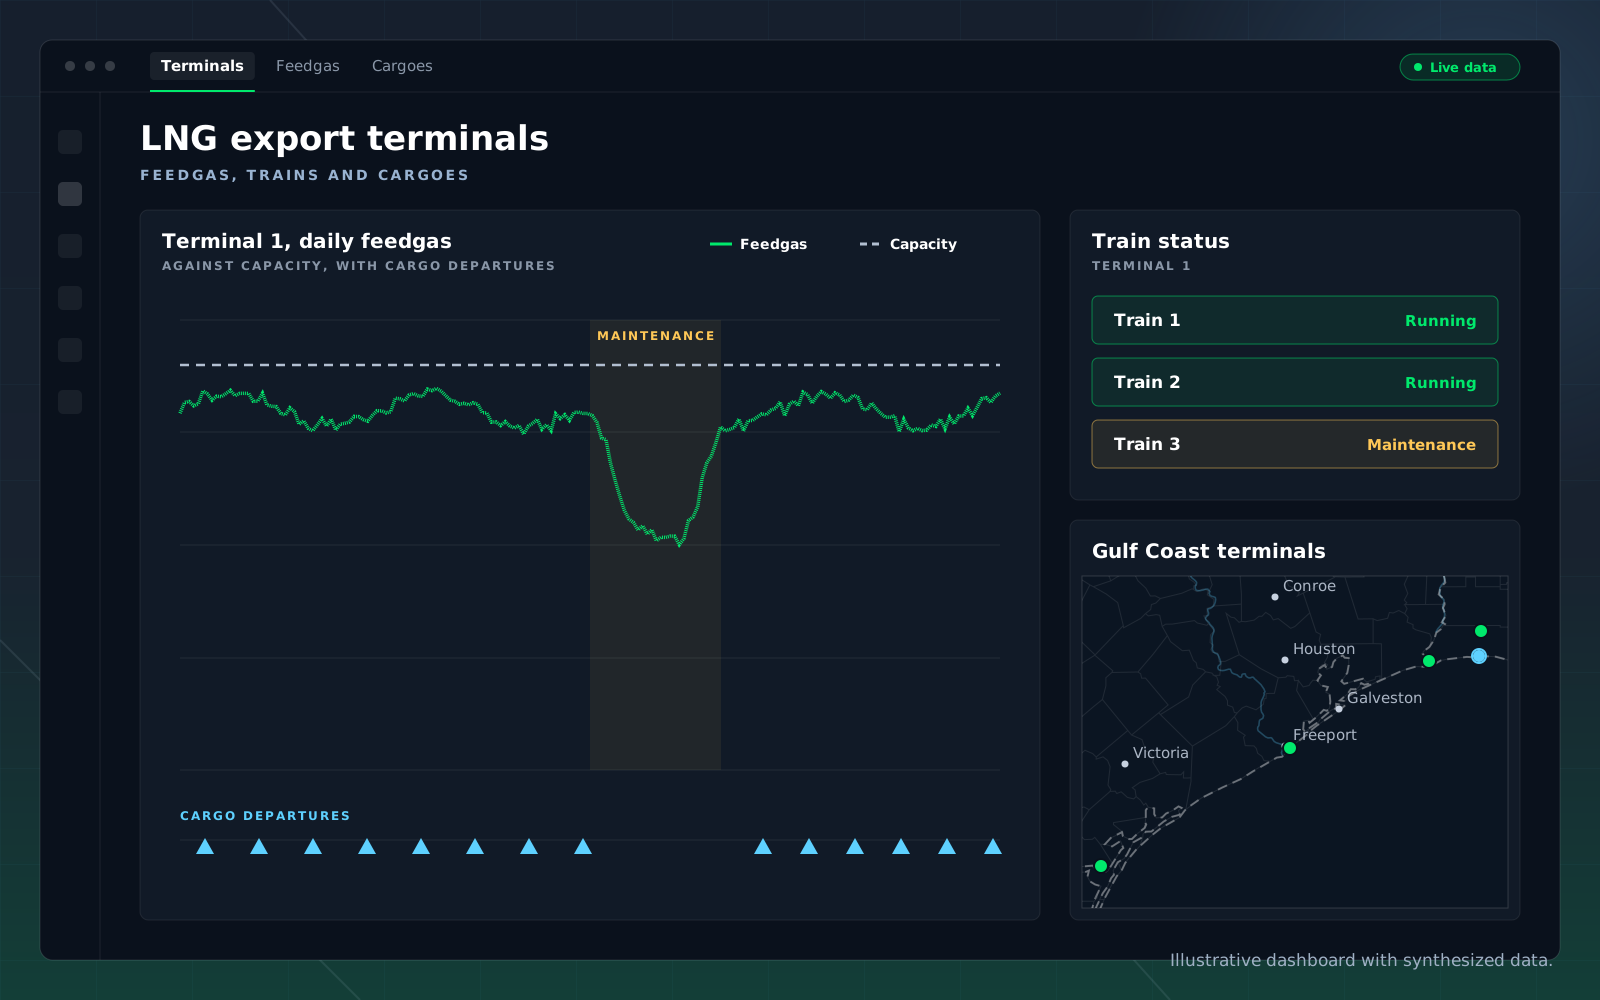
Feedgas, terminal activity, storage and cargo are joined on one timeline for each facility, so a gap between nominated and actual volume shows up where it opens.
The Gap
Volume moves between systems that do not talk to each other.
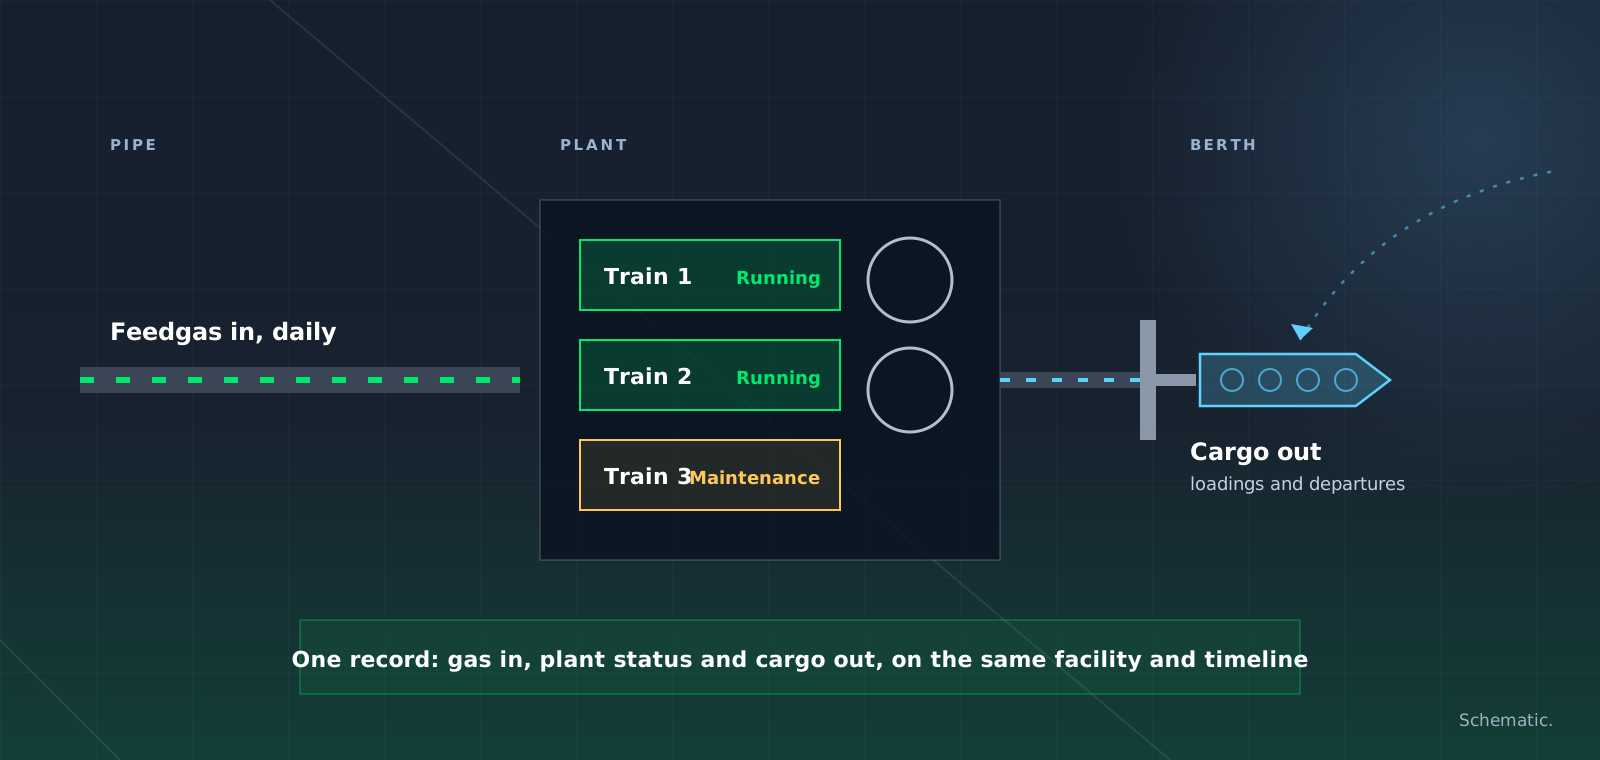
Pipeline, terminal, storage and shipping data each live in their own silo. The discrepancies that matter commercially are the ones that only appear when you join them.

Feedgas against capacity

Terminal activity

Storage in between

Joined end to end
In Practice
Find where volume falls short.
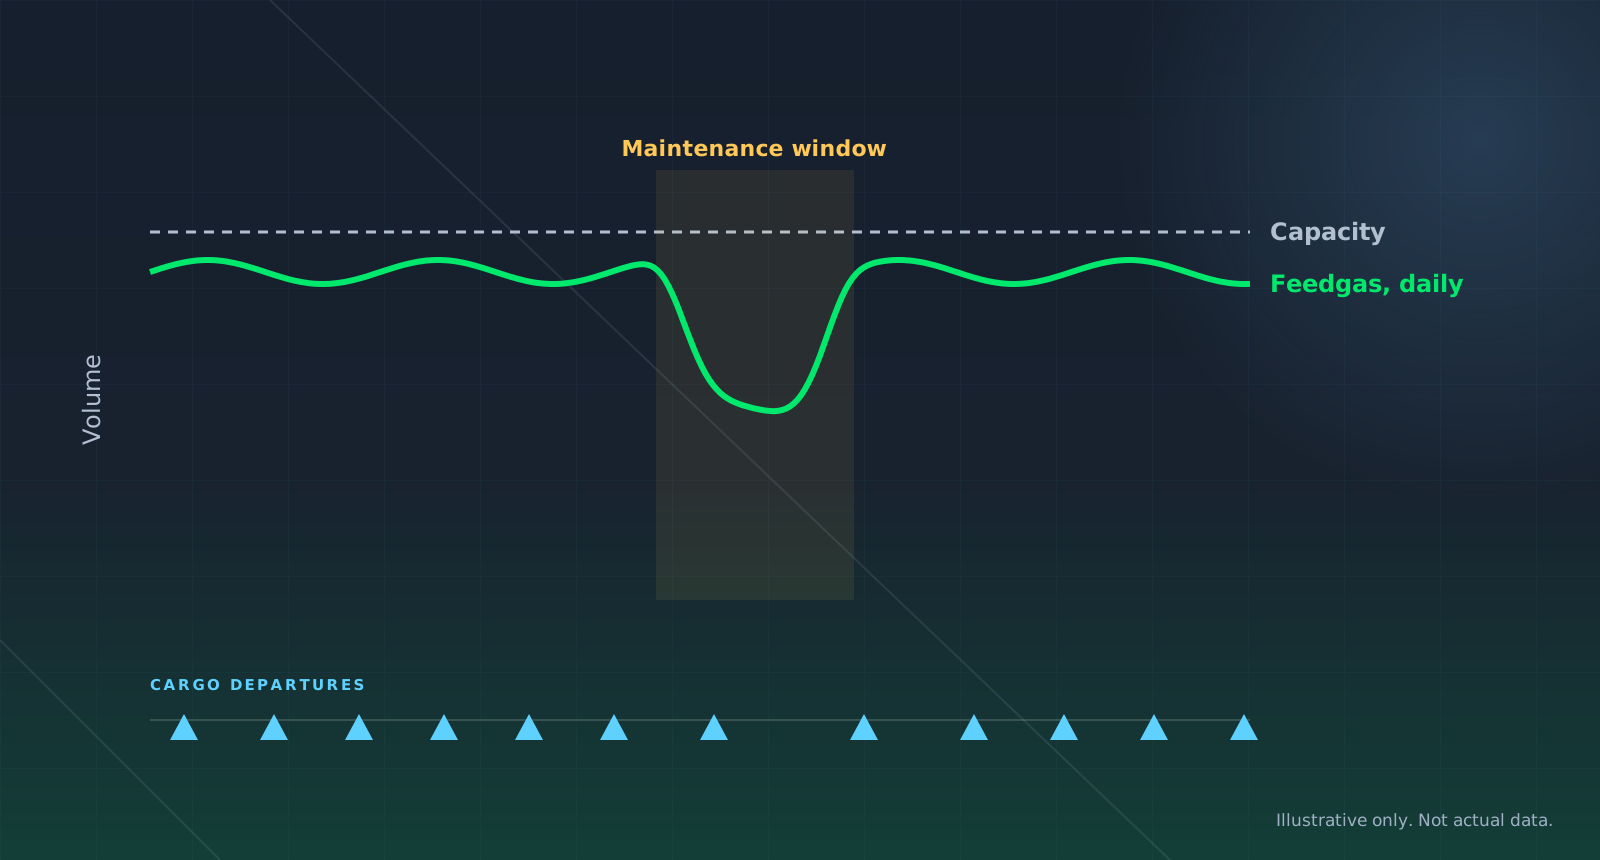
Nominations say what a facility intends to pull. Set observed daily feedgas against capacity and against the cargo record, and a shortfall shows where it opens: at the pipe, at the plant or at the berth.
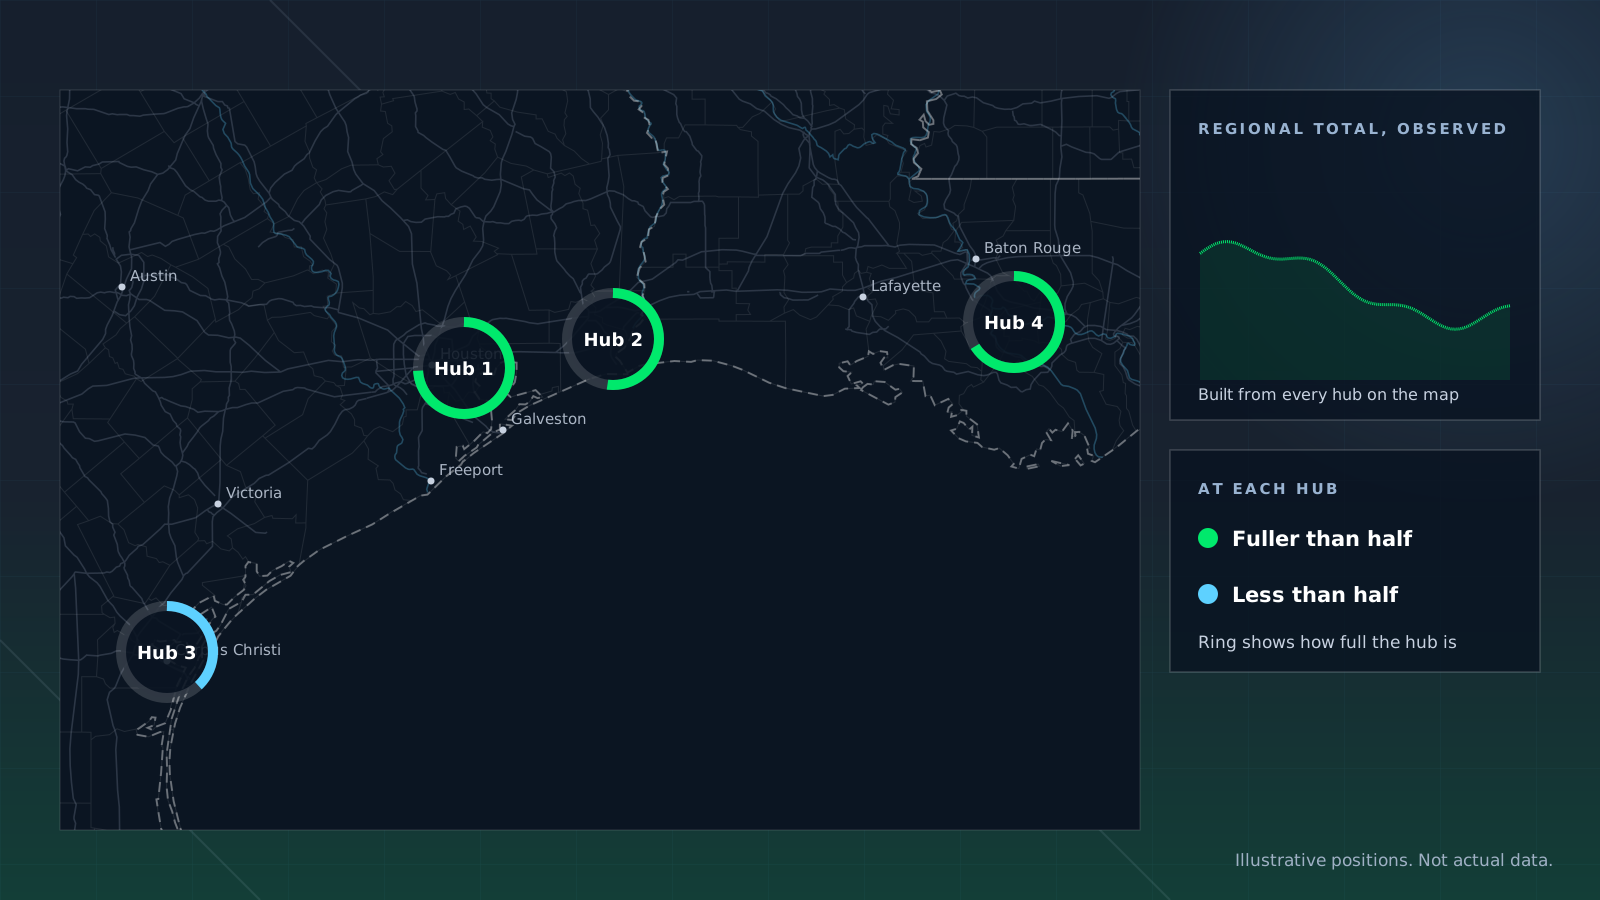
Tank levels at hubs and terminals fill in the inventory that sits between pipe and ship.
Storage in Between
Fill in what sits between pipe and ship.
Tank levels at hubs and terminals fill in the inventory that sits between pipeline deliveries and the cargo record.
Joined to the same facilities and timeline, every stage of the system reads as one flow, so a discrepancy in volume is visible where it opens.
On Your Desk
What a midstream team gets.
In the Platform
Your terminals, end to end.
Feedgas against capacity, train status and cargo departures, on one timeline.
Use Cases
The questions this desk asks.
What is daily feedgas demand at this terminal?
How much throughput is this terminal actually handling?
What are storage levels at this hub?

Where are cargoes from this facility going?

Where is volume falling short of nominations?

Is this plant running every train?
Capabilities
What answers them.
Hyperion
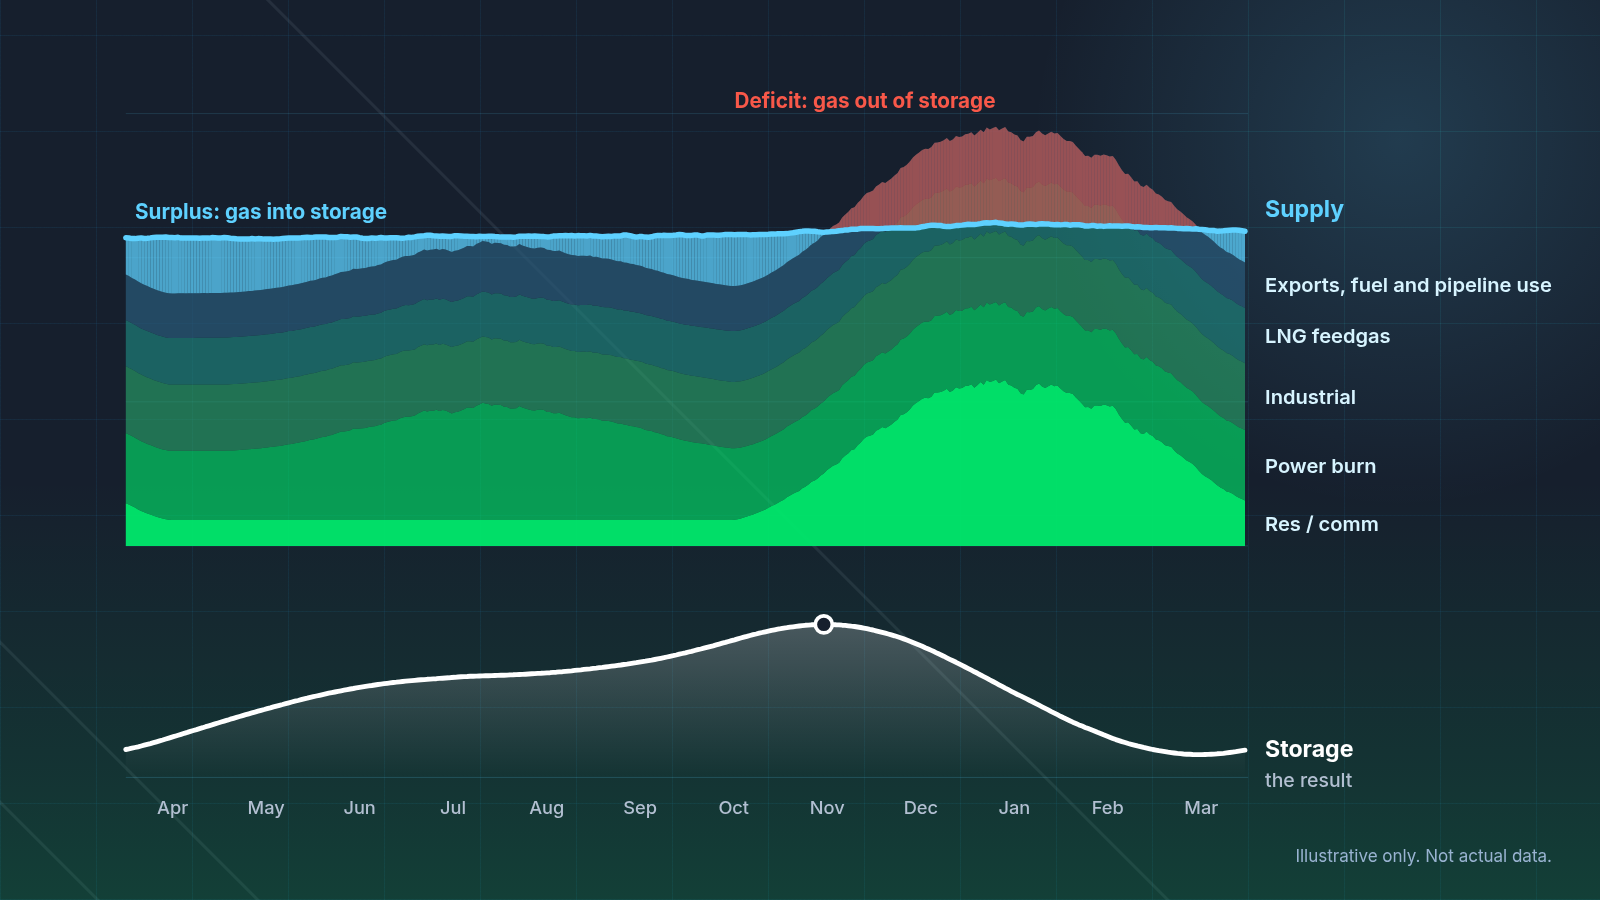
Supply & Demand Balances
US natural gas supply against every demand term, balanced daily and rolled into a storage outlook two years forward.
Hyperion
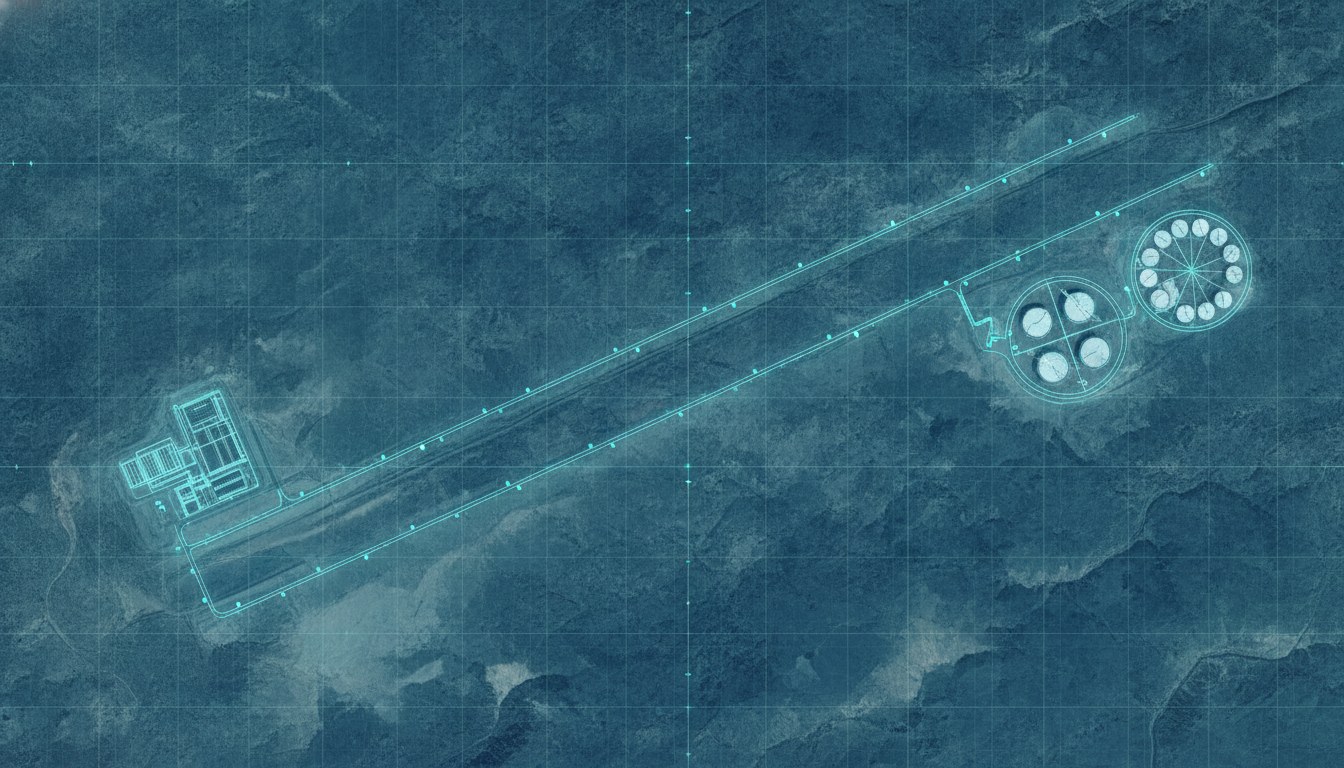
LNG Flows & Cargo Tracking
Daily feedgas demand and cargo movement, followed from the pipeline through to the tanker.
Hyperion · BasinIQ
Storage, Terminals & Inventory
Tank and terminal activity read from imagery, for an inventory picture that does not wait on the next report.
Hyperion
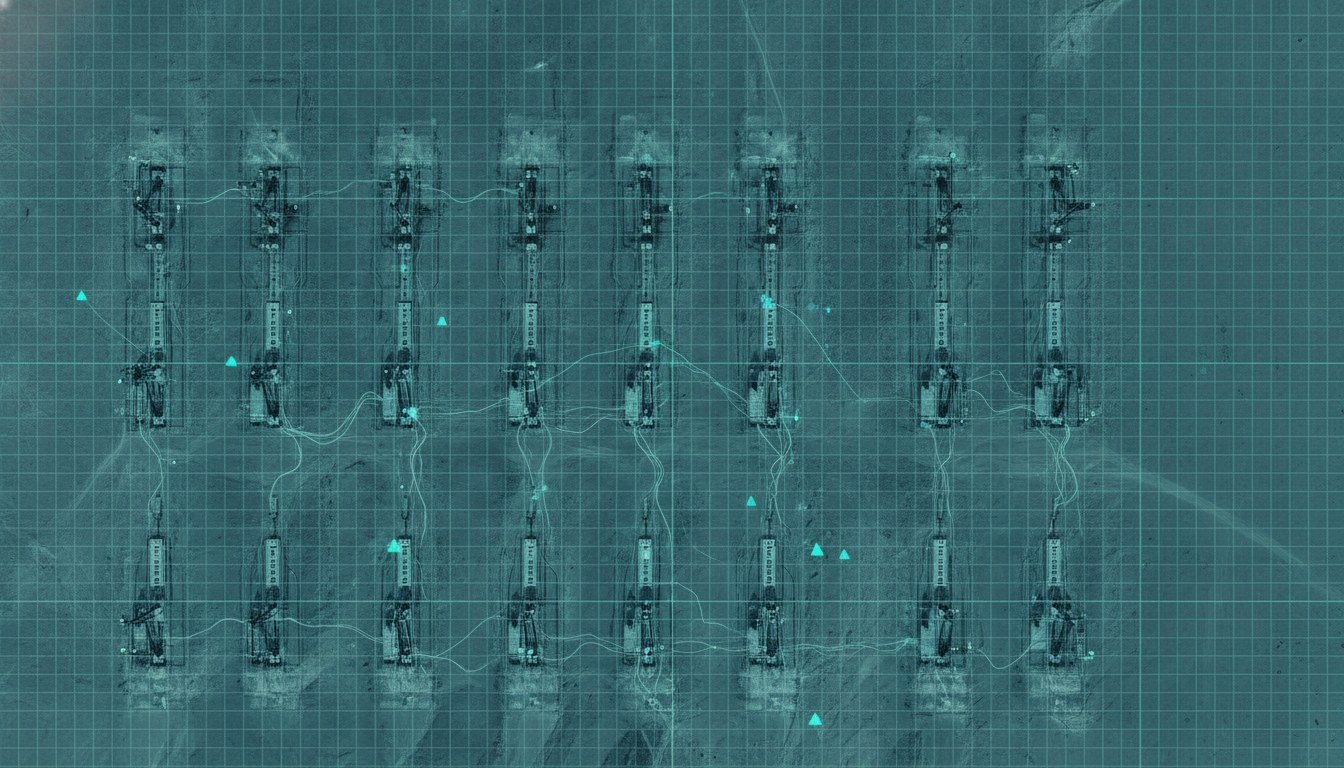
Production Monitoring & Forecasting
Well-level production history and forward forecasts across US oil and gas, with natural gas supply and demand balances that move as field activity does.
FAQ
Questions buyers ask.
What is daily feedgas demand at a terminal?
Daily pipeline deliveries into each liquefaction facility, measured rather than nominated.
Can you tell if a plant is running every train?
Yes. Imagery and thermal signal confirm whether each train is running, in maintenance or down.
Where does volume fall short of nominations?
Observed feedgas, plant status and cargo are joined on one timeline, so a gap between nominated and actual volume is visible where it opens.
Do you cover storage hubs?
Yes. Tank levels at hubs and terminals are read from imagery and tied to the same facilities.
How does this connect to the gas balance?
LNG feedgas by terminal is one of the demand terms in the Hyperion supply and demand balance.
How do I get the data?
In the platform, through agents, by API, in Snowflake or in Excel, so the answer arrives in the system your team already uses.
Get Started
See a facility end to end.
Name a terminal or a hub and we will show you feedgas, storage and cargo on a single timeline.