

Capabilities
What the energy system
is actually doing.
Start with the question you need answered.
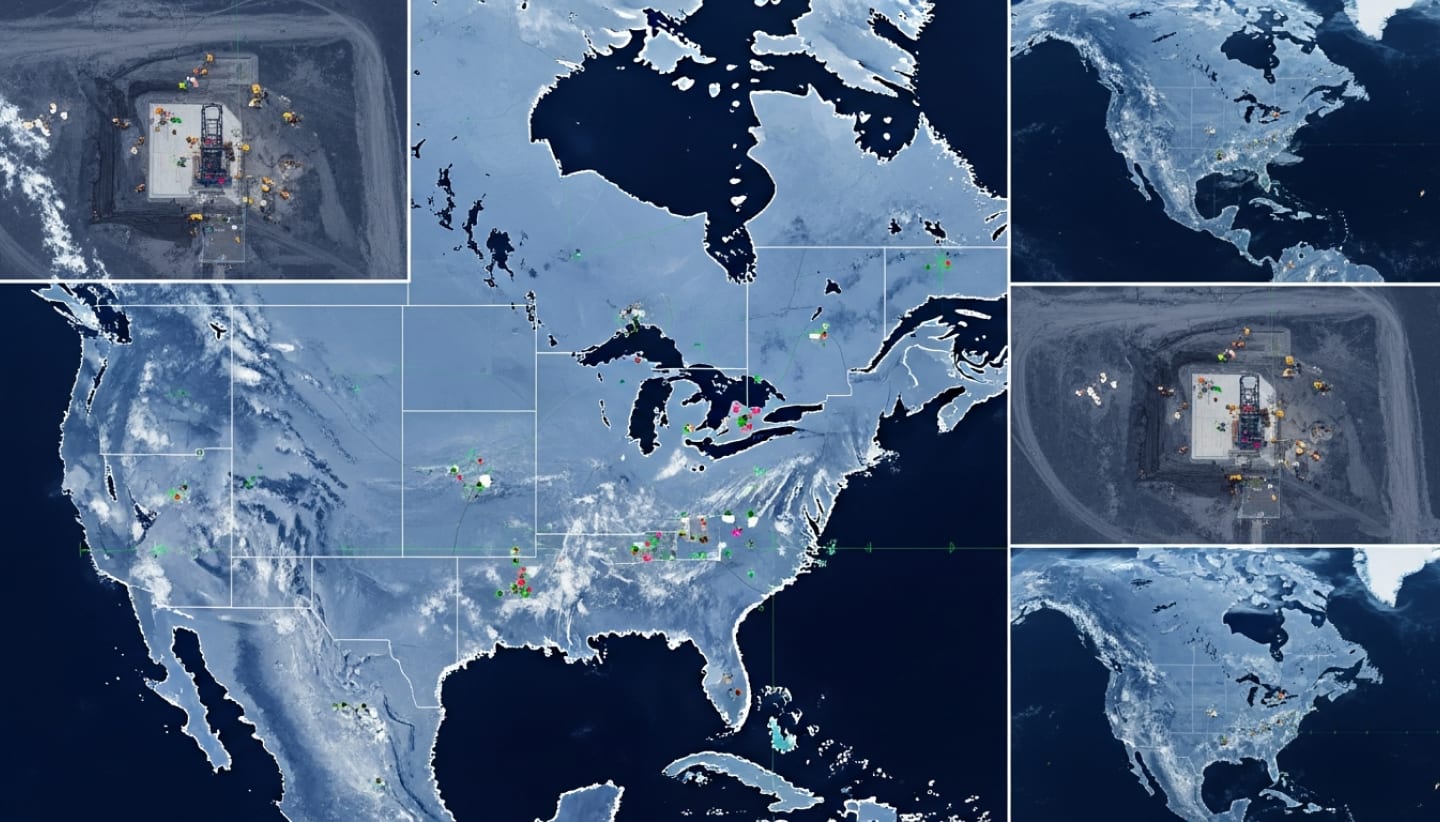
Every answer below starts with observation of the asset, built on more than 40M km² of imagery a day, and is reconciled against the public record, so it moves before the reports everyone else is waiting on.
Supply
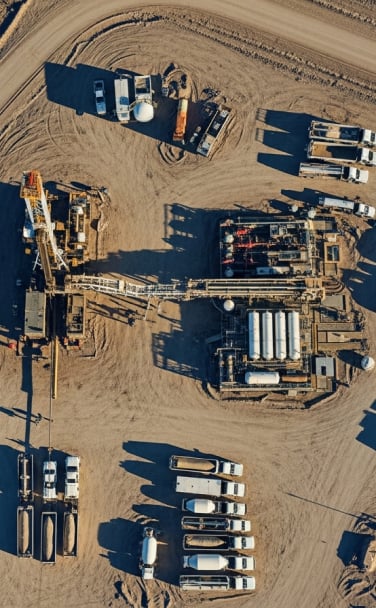
Drilling & Completion Activity
Where are rigs and frac crews working right now?
Rigs, frac crews, DUCs and completions counted on the pad, for every operator.
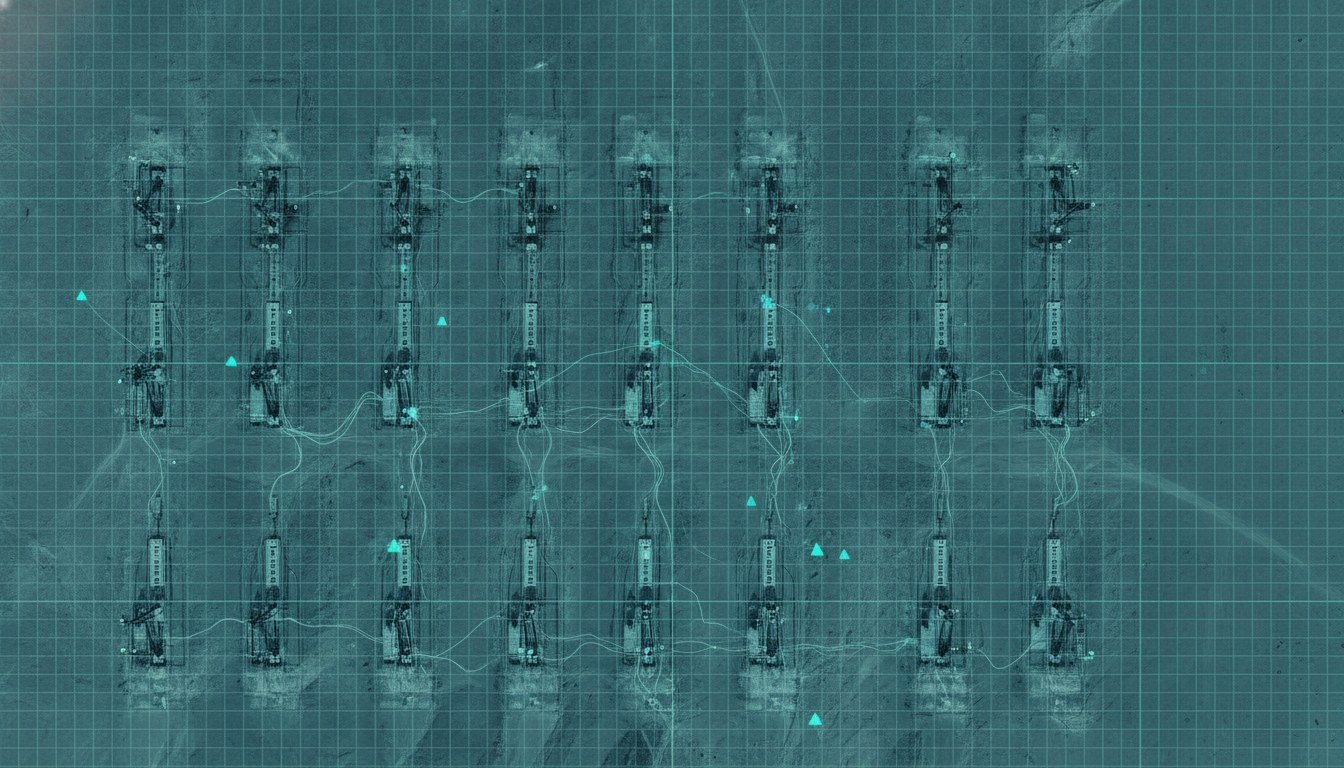
Production Monitoring & Forecasting
What is each operator really producing?
Well-level history and forecasts, measured before it is reported.
Gas markets
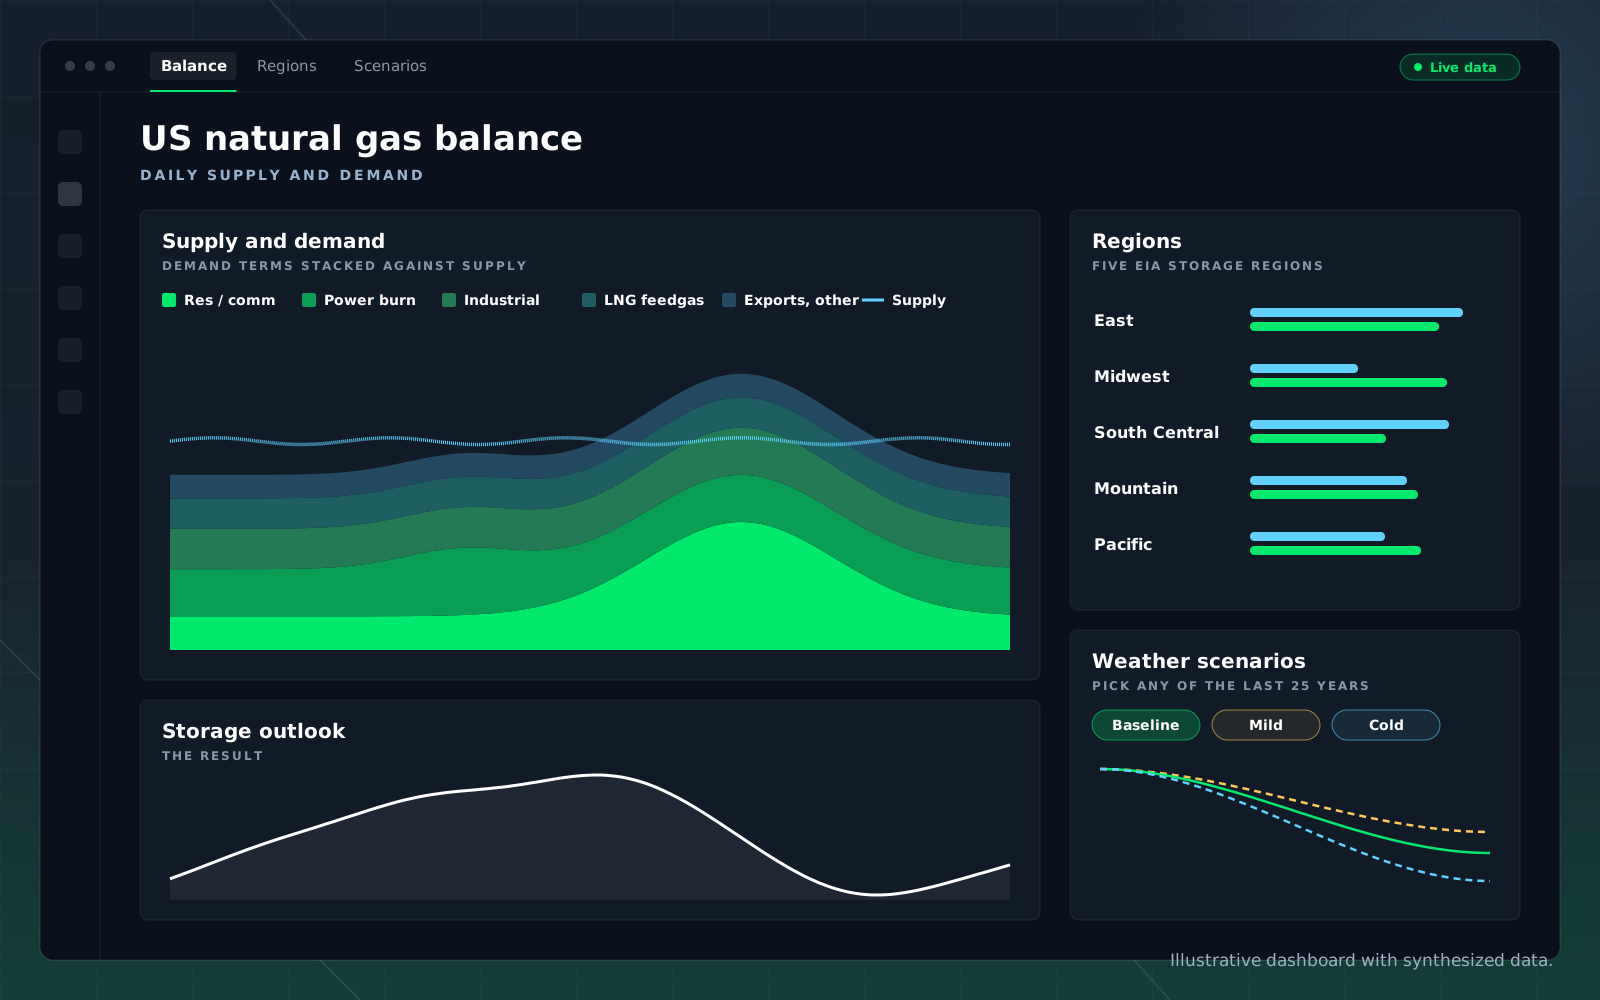
Supply & Demand Balances
Where is US gas storage heading?
Supply against every demand term, balanced daily, two years forward.
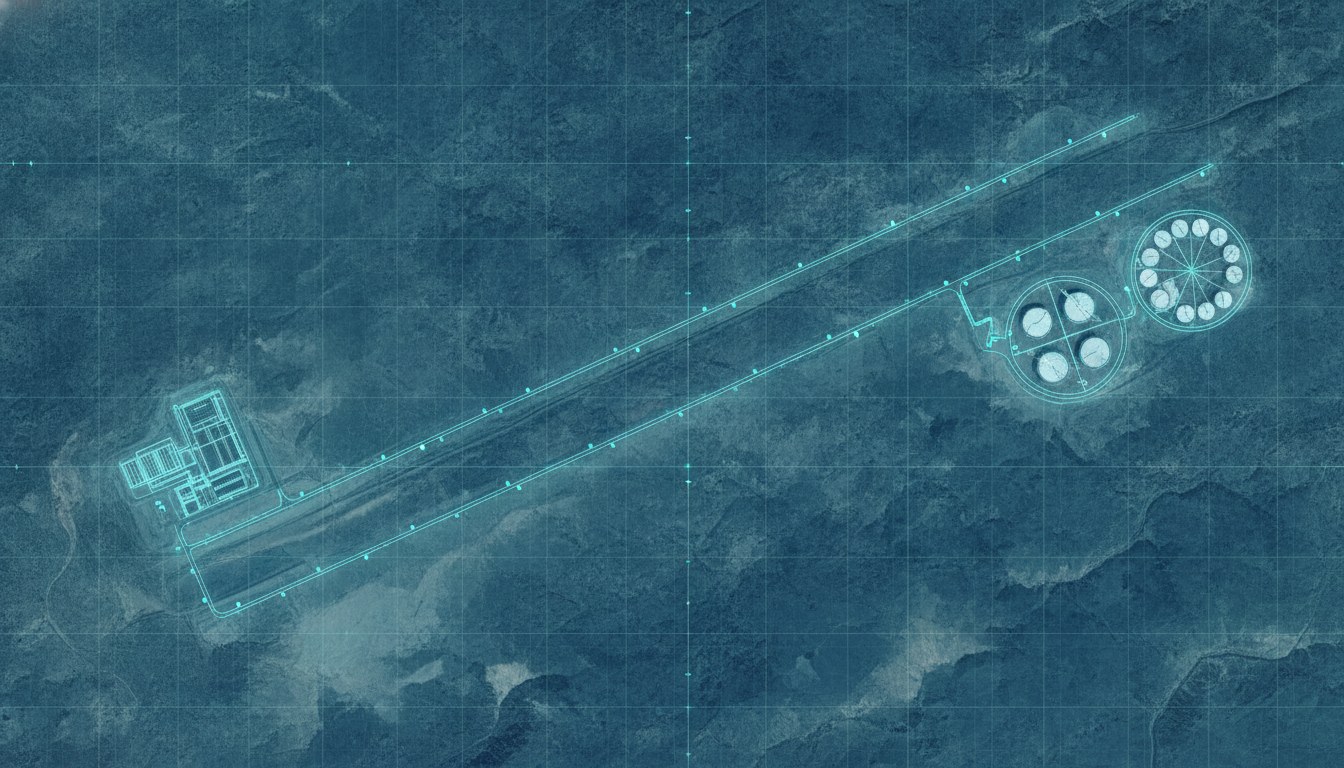
LNG Flows & Cargo Tracking
What is each terminal pulling and shipping?
Feedgas, plant status and cargoes on one record.
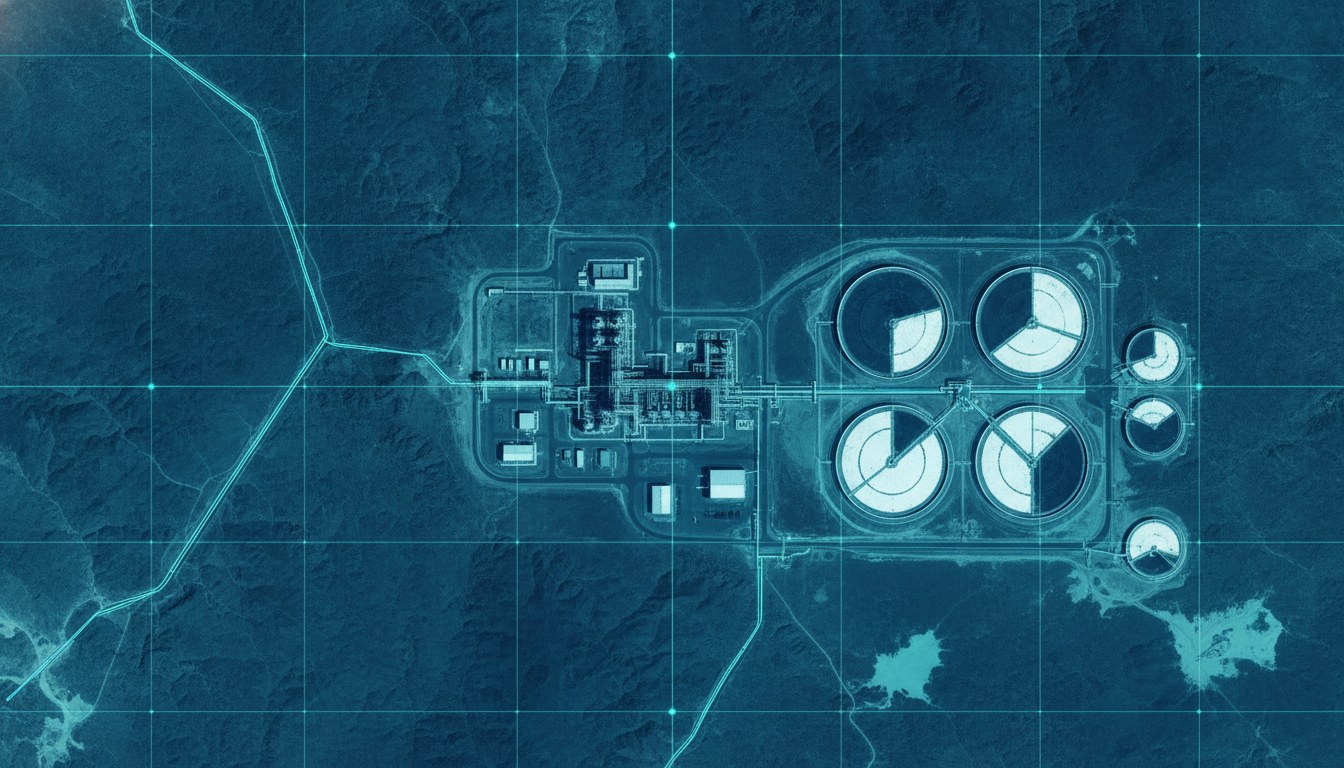
Storage, Terminals & Inventory
What is in the tanks before the release?
Inventory built facility by facility at hubs and terminals.
Build-out
Construction & Project Completion
Which announced projects are actually being built?
Every project tracked from groundbreaking to commissioning.
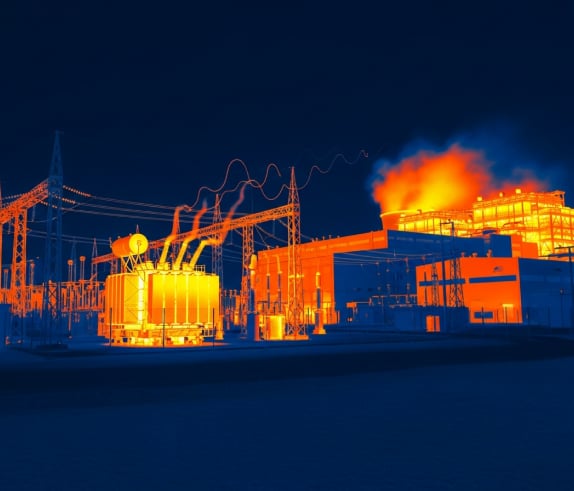
Power & Datacenter Buildout
When will new power and load arrive?
Plants and data centers tracked through the build and into operation.
Prefer to start from your role? See solutions by desk →
One Record
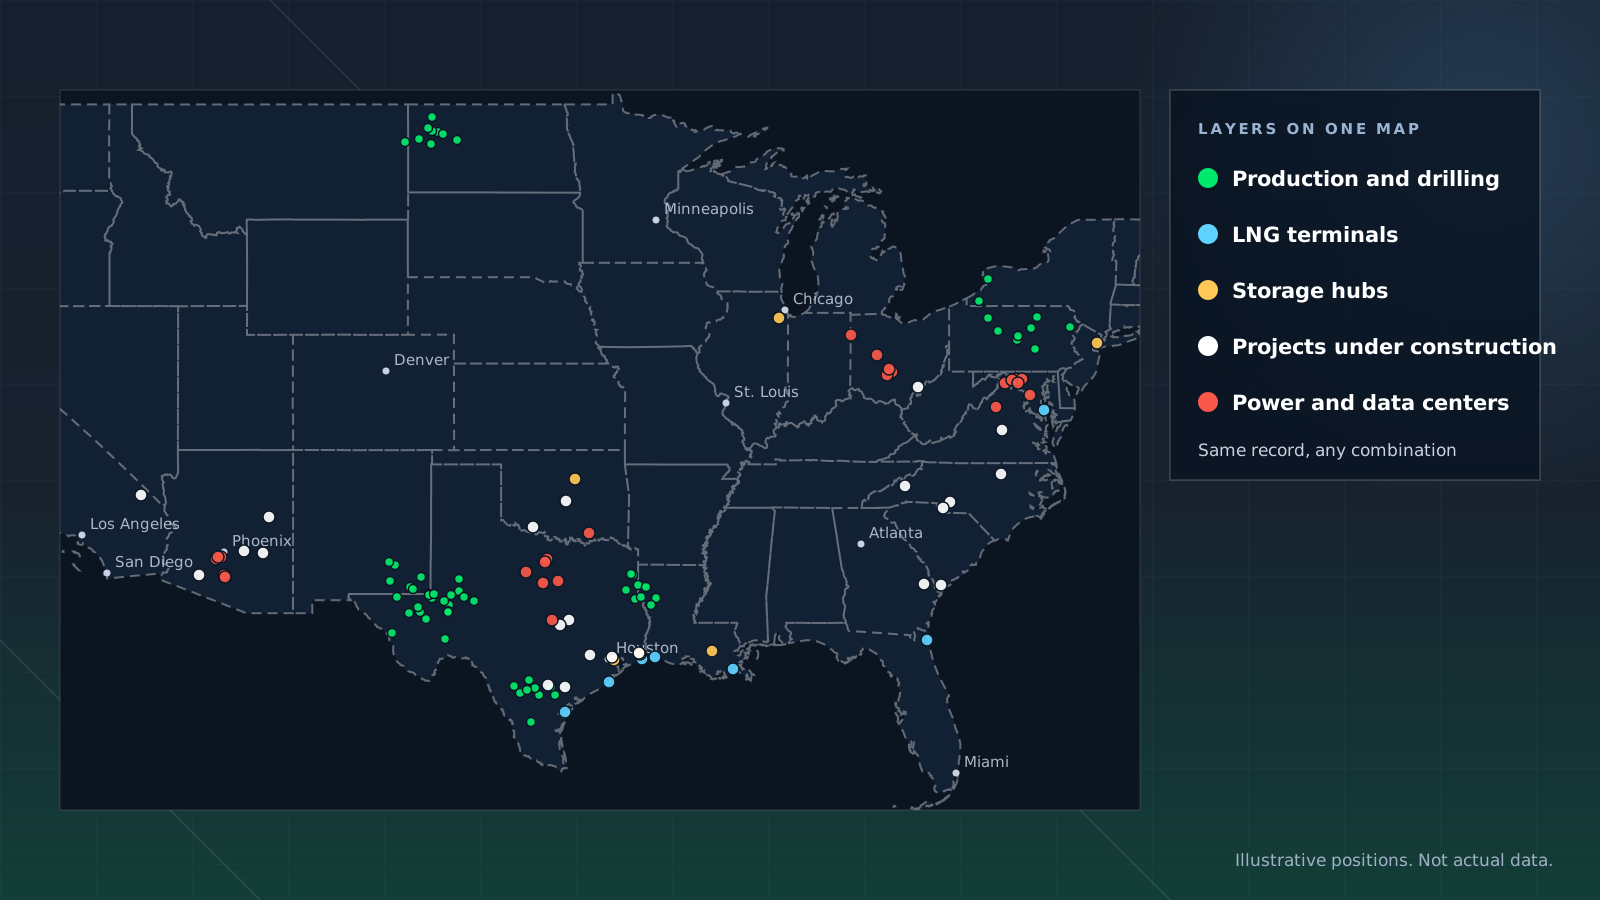
Every layer, one map.
Production, drilling, LNG flows, storage, construction and power buildout are measured the same way and kept on the same record. Turn on the layers your question needs and read them together for one asset, one basin or the whole country.
A supply question can pull in pads and production. A power question can pull in plants, data centers and gas burn. Nothing has to be joined by hand first.
In the Platform
Delivered where you work.
Every capability comes through the same platform, so production, flows, inventory and construction for one asset or region sit side by side.
Prefer your own tools? The same record arrives through agents, by API, in Snowflake or in Excel.
The Standard
Measurement, then reconciliation.
Public energy data arrives late and incomplete, and every desk reading it reaches the same conclusion at the same time. The capabilities below start somewhere else: with direct observation of the asset, cross-checked until the answer holds.

Independent observation

Cross-confirmed

Modeled by people who know the asset

Delivered where you work
FAQ
Questions buyers ask.
Which capability do I need?
Start with the question you need answered above. If you would rather start from your role, the Solutions pages arrange the same capabilities around the decisions each desk makes.
Can I combine capabilities?
Yes. They share one record, so production, activity, flows, inventory and construction can be read together for the same asset, basin or region.
Where does the data come from?
Measurement starts with satellite imagery and other sensing of physical assets. Every signal is cross-checked against independent sources and reconciled against the public record.
Do you cover private operators and projects?
Yes. Observation does not depend on disclosure, so private operators and projects are measured on the same basis as public ones.
How do capabilities relate to Hyperion, BasinIQ and Vulcan?
Capabilities describe what is measured. Hyperion, BasinIQ and Vulcan are the products that deliver them, and each capability page names the products it comes in.
How is it delivered?
In the platform, through agents, by API, in Snowflake or in Excel, so the answer arrives in the system your team already uses.
Get Started
Tell us what you need measured.
Bring the question your current data cannot answer and we will show you which of these capabilities covers it, and what the answer looks like on your assets.